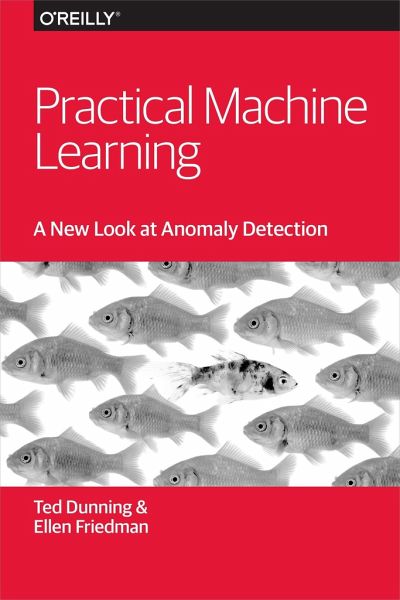
Practical Machine Learning: A New Look at Anomaly Detection

PAYBACK Punkte
11 °P sammeln!
Finding Data Anomalies You Didn't Know to Look For
Anomaly detection is the detective work of machine learning: finding the unusual, catching the fraud, discovering strange activity in large and complex datasets. But, unlike Sherlock Holmes, you may not know what the puzzle is, much less what “suspects” you’re looking for. This O’Reilly report uses practical examples to explain how the underlying concepts of anomaly detection work.
From banking security to natural sciences, medicine, and marketing, anomaly detection has many useful applications in this age of big data. And the search for anomalies will intensify once the Internet of Things spawns even more new types of data. The concepts described in this report will help you tackle anomaly detection in your own project.
Use probabilistic models to predict what’s normal and contrast that to what you observe
Set an adaptive threshold to determine which data falls outside of the normal range, using the t-digest algorithm
Establish normal fluctuations in complex systems and signals (such as an EKG) with a more adaptive probablistic model
Use historical data to discover anomalies in sporadic event streams, such as web traffic
Learn how to use deviations in expected behavior to trigger fraud alerts


