Schade – dieser Artikel ist leider ausverkauft. Sobald wir wissen, ob und wann der Artikel wieder verfügbar ist, informieren wir Sie an dieser Stelle.
- Gebundenes Buch
- Merkliste
- Auf die Merkliste
- Bewerten Bewerten
- Teilen
- Produkt teilen
- Produkterinnerung
- Produkterinnerung
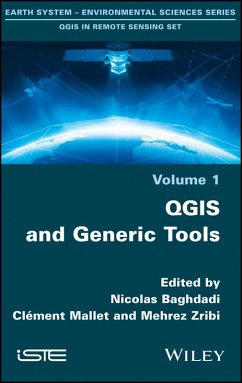
These four volumes present innovative thematic applications implemented using the open source software QGIS. These are applications that use remote sensing over continental surfaces. The volumes detail applications of remote sensing over continental surfaces, with a first one discussing applications for agriculture. A second one presents applications for forest, a third presents applications for the continental hydrology, and finally the last volume details applications for environment and risk issues.
Andere Kunden interessierten sich auch für
![Qgis and Applications in Territorial Planning Qgis and Applications in Territorial Planning]() Qgis and Applications in Territorial Planning183,99 €
Qgis and Applications in Territorial Planning183,99 €![Engineering Tools for Environmental Risk Management Engineering Tools for Environmental Risk Management]() Engineering Tools for Environmental Risk Management209,99 €
Engineering Tools for Environmental Risk Management209,99 €![Precautionary Tools for Reshaping Environmental Policy Precautionary Tools for Reshaping Environmental Policy]() Nancy J. Myers / Carolyn Raffensperger (eds.)Precautionary Tools for Reshaping Environmental Policy11,99 €
Nancy J. Myers / Carolyn Raffensperger (eds.)Precautionary Tools for Reshaping Environmental Policy11,99 €![Environmental Impacts of Land Use in Rural Regions: The Development, Validation and Application of Model Tools for Management and Policy Analysis Environmental Impacts of Land Use in Rural Regions: The Development, Validation and Application of Model Tools for Management and Policy Analysis]() Piet GroenendijkEnvironmental Impacts of Land Use in Rural Regions: The Development, Validation and Application of Model Tools for Management and Policy Analysis104,99 €
Piet GroenendijkEnvironmental Impacts of Land Use in Rural Regions: The Development, Validation and Application of Model Tools for Management and Policy Analysis104,99 €![Strategies and Tools for a Sustainable Rural Rio de Janeiro Strategies and Tools for a Sustainable Rural Rio de Janeiro]() Strategies and Tools for a Sustainable Rural Rio de Janeiro112,99 €
Strategies and Tools for a Sustainable Rural Rio de Janeiro112,99 €![Tools and Methods for Pollution Prevention Tools and Methods for Pollution Prevention]() SikdarTools and Methods for Pollution Prevention77,99 €
SikdarTools and Methods for Pollution Prevention77,99 €![Tools for Land Use Analysis on Different Scales Tools for Land Use Analysis on Different Scales]() Bas BoumanTools for Land Use Analysis on Different Scales39,99 €
Bas BoumanTools for Land Use Analysis on Different Scales39,99 €-
These four volumes present innovative thematic applications implemented using the open source software QGIS. These are applications that use remote sensing over continental surfaces. The volumes detail applications of remote sensing over continental surfaces, with a first one discussing applications for agriculture. A second one presents applications for forest, a third presents applications for the continental hydrology, and finally the last volume details applications for environment and risk issues.
Produktdetails
- Produktdetails
- Verlag: Wiley
- Seitenzahl: 310
- Erscheinungstermin: 13. März 2018
- Englisch
- Abmessung: 239mm x 163mm x 23mm
- Gewicht: 340g
- ISBN-13: 9781786301871
- ISBN-10: 1786301873
- Artikelnr.: 50508854
- Herstellerkennzeichnung
- Libri GmbH
- Europaallee 1
- 36244 Bad Hersfeld
- gpsr@libri.de
- Verlag: Wiley
- Seitenzahl: 310
- Erscheinungstermin: 13. März 2018
- Englisch
- Abmessung: 239mm x 163mm x 23mm
- Gewicht: 340g
- ISBN-13: 9781786301871
- ISBN-10: 1786301873
- Artikelnr.: 50508854
- Herstellerkennzeichnung
- Libri GmbH
- Europaallee 1
- 36244 Bad Hersfeld
- gpsr@libri.de
Nicolas Baghdadi, French Research Institute of Science and Technology for Environment and Agriculture, France Mehrez Zribi, CNRS and CESBIO, France Clément Maillet, ING, France
Introduction ix
Chapter 1. Introduction to QGIS 1
Nicolas MOYROUD and Frédéric PORTET
1.1. History 1
1.2. QGIS graphical user interface 2
1.2.1. Standard interface 2
1.2.2. Settings 3
1.2.3. Add layer 4
1.2.4. QGIS project. 5
1.2.5. Navigation 5
1.2.6. Attributes of entities 6
1.3. The processing module, the toolkit for spatial analysis 6
1.3.1. History and interest of the treatment module 6
1.3.2. Presentation of the toolbox and its algorithms 7
1.3.3. Example of an algorithm's execution 10
1.3.4. Adding custom Python scripts 11
1.3.5. The graphic modeler 13
1.3.6. Batch processing 16
Chapter 2. Introduction to GDAL Tools in QGIS 19
Kenji OSE
2.1. GDAL: The Swiss army knife of raster processing 19
2.1.1. What is GDAL used for? 19
2.1.2. Licenses 19
2.1.3. How is GDAL used? 20
2.1.4. How GDAL works in QGIS 23
2.2. GDAL tools: Practical examples 26
2.2.1. Introduction 26
2.2.2. Useful data 27
2.2.3. Reading image metadata 29
2.2.4. Basic processing of raster files 33
2.2.5. Analysis tools 44
2.3. Bibliography 65
Chapter 3. GRASS GIS Software with QGIS 67
Bernard LACAZE, Julita DUDEK and Jérôme PICARD
3.1. Presentation 67
3.1.1. GRASS software: A modular GIS package 67
3.1.2. Vector functions (v.*) 68
3.1.3. GIS raster functions (r.*) 70
3.1.4. Imagery functions (i.* or r.*) 73
3.1.5. Temporal functions 74
3.2. GRASS GIS download and GRASS plugin in QGIS 77
3.2.1. Operating systems for GRASS GIS software 77
3.2.2. QGIS interface for GRASS GIS 77
3.3. GRASS GIS capabilities 79
3.3.1. Definition of a GRASS GIS project: Location and mapsets 79
3.3.2. Modifications of the GRASS region 80
3.3.3. Importing raster data into GRASS 81
3.3.4. Importing vector data into GRASS 83
3.3.5. Image georeferencing 84
3.3.6. Radiometric preprocessing of images 85
3.3.7. Pan-sharpening 86
3.3.8. Computation of spectral indices and biophysical parameters 86
3.3.9. Classifications and segmentation 87
3.4. Using Grass GIS functions from QGIS 89
3.4.1. Creating, opening, closing a dataset and adding a raster file 90
3.4.2. Creating, adding, editing a vector layer 95
3.4.3. Examples of image processing with QGIS-GRASS 97
3.5. Acknowledgments 106
3.6. Bibliography 106
Chapter 4. The Use of SAGA GIS Modules in QGIS 107
Paul PASSY and Sylvain THÉRY
4.1. SAGA GIS in QGIS 107
4.1.1. Development of SAGA GIS 107
4.1.2. SAGA GIS interface in QGIS 108
4.2. Using SAGA GIS to work with multispectral satellite images 111
4.2.1. Methodology 111
4.2.2. Acquisition and presentation of used data 112
4.2.3. Correction of the satellite images 112
4.2.4. Cropping the images according to the study area 115
4.2.5. Color composites and exploration of the area 116
4.2.6. Calculation of indices in order to extract vegetation and water
surfaces 119
4.3. Hydrological network extraction using SAGA GIS in QGIS 131
4.3.1. Interests 131
4.3.2. DEM preprocessing 132
4.3.3. Filling sinks 135
4.3.4. Hydrographic network extraction 137
4.4. Interpolation using SAGA GIS 140
4.4.1. Principle of the interpolation 140
4.4.2. Interpolation of measures of water quality in the aquifers of the
Seine basin 140
4.5. Bibliography 148
Chapter 5. Orfeo ToolBox Applications 151
Rémi CRESSON, Manuel GRIZONNET and Julien MICHEL
5.1. The Orfeo ToolBox 151
5.1.1. Introduction 151
5.1.2. History 151
5.1.3. Application features 153
5.1.4. Governance and community 153
5.1.5. C++ library 155
5.1.6. Internal mechanisms 156
5.1.7. Download and installation 158
5.2. Using OTB applications 158
5.2.1. Interface 158
5.2.2. Command line interface 161
5.2.3. Graphical user interface 164
5.2.4. Use from QGIS 165
5.2.5. Python bindings 165
5.2.6. Monteverdi 166
5.3. Exercises 167
5.3.1. Basic tools 167
5.3.2. Applications for image preprocessing 190
5.3.3. Feature extraction applications 221
5.3.4. Classification 231
5.4. Conclusion 240
5.5. Acknowledgments 240
5.6. Bibliography 240
Chapter 6. Online Publication of a Land Cover Map Using LizMap 243
Jean-Baptiste LAURENT and Louise LEROUX
6.1. Context 243
6.2. Workflow to publish a map online using LizMap 244
6.2.1. Presentation of LizMap 245
6.2.2. Main steps for publishing a map online with LizMap 246
6.3. Implementation with QGIS 247
6.3.1. Setup a QGIS project for Web 247
6.3.2. Setup a QGIS project for LizMap 248
6.3.3. Publish the map by FTP 251
6.3.4. Some tips to go further 253
6.4. Bibliography 255
Chapter 7. GeoHealth and QuickOSM, Two QGIS Plugins for Health Applications
257
Vincent HERBRETEAU, Christophe RÉVILLION and Etienne TRIMAILLE
7.1. Background on the use of GIS for health and the development of
dedicated plugins in QGIS 257
7.2. Methodology 258
7.2.1. Importing data 259
7.2.2. Case geolocation 260
7.2.3. Data anonymization ("blurring") 260
7.2.4. Creating an incidence or density map 262
7.2.5. Importing data from the OSM database 262
7.2.6. Environmental analyses 264
7.2.7. Export 265
7.3. Implementation: GeoHealth, assisted mapping with QGIS 267
7.3.1. Installation of GeoHealth and QuickOSM plugins 267
7.3.2. Datasets 268
7.3.3. Producing an incidence map with the GeoHealth plugin 268
7.3.4. "Blurring" of point data with GeoHealth and QuickOSM plugins 271
7.3.5. Example of spatial analyzes for health studies 277
7.3.6. Contribution to the OSM database using satellite images 281
7.4. Bibliography 286
List of Authors 287
Index 289
Scientific Committee 293

