- Broschiertes Buch
- Merkliste
- Auf die Merkliste
- Bewerten Bewerten
- Teilen
- Produkt teilen
- Produkterinnerung
- Produkterinnerung
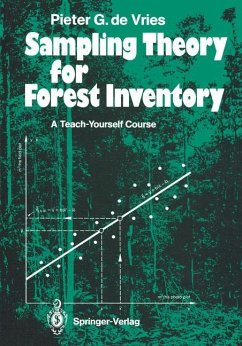
Forest inventory may be defined as the technique of collecting, evaluating and presenting specified information on forest areas. Because of the generally la~ge extent of forest areas, data are usually collected by sampling, i.e. by making observations on only part of the area of interest. As there are many different sampling methods (e.g. Appendix 1), a choice must first be made as to which method suits the given field and financial circumstances best. On completion of the sampling procedure, the numerous data collected have next to be condensed to manageable representative quantities.…mehr
Andere Kunden interessierten sich auch für
![Sampling Methods, Remote Sensing and GIS Multiresource Forest Inventory Sampling Methods, Remote Sensing and GIS Multiresource Forest Inventory]() Michael KöhlSampling Methods, Remote Sensing and GIS Multiresource Forest Inventory161,99 €
Michael KöhlSampling Methods, Remote Sensing and GIS Multiresource Forest Inventory161,99 €![Designing and Conducting a Forest Inventory - case: 9th National Forest Inventory of Finland Designing and Conducting a Forest Inventory - case: 9th National Forest Inventory of Finland]() Erkki TomppoDesigning and Conducting a Forest Inventory - case: 9th National Forest Inventory of Finland121,99 €
Erkki TomppoDesigning and Conducting a Forest Inventory - case: 9th National Forest Inventory of Finland121,99 €![Forest Inventory Forest Inventory]() Eduardo Pagel FlorianoForest Inventory55,99 €
Eduardo Pagel FlorianoForest Inventory55,99 €![Wheat Wheat]() Y. P. S. BajajWheat244,99 €
Y. P. S. BajajWheat244,99 €![Transgenic Crops V Transgenic Crops V]() Eng Chong Pua / Michael R. Davey (eds.)Transgenic Crops V241,99 €
Eng Chong Pua / Michael R. Davey (eds.)Transgenic Crops V241,99 €![Transgenic Crops V Transgenic Crops V]() Transgenic Crops V241,99 €
Transgenic Crops V241,99 €![Wheat Wheat]() Y. P. S. BajajWheat177,99 €
Y. P. S. BajajWheat177,99 €-
-
-
Forest inventory may be defined as the technique of collecting, evaluating and presenting specified information on forest areas. Because of the generally la~ge extent of forest areas, data are usually collected by sampling, i.e. by making observations on only part of the area of interest. As there are many different sampling methods (e.g. Appendix 1), a choice must first be made as to which method suits the given field and financial circumstances best. On completion of the sampling procedure, the numerous data collected have next to be condensed to manageable representative quantities. Finally, from these quantities, inferences about the situation in the entire forest area are made, preferably accompanied by an indication of their reliability. This book is intended for students who want to know the whepefope of the sampling techniques used in forest inventory. The danger of lack of knowledge is a blind following of instructions and copying statistical formulae, or, even worse, feeding data into a computer loaded with a program that is said to print out the required information. In serious persons, such approaches may leave a feeling of dissatisfaction or even of professional incompetence, be cause of inability to direct or evaluate the procedure critically. If a student tries to improve his or her situation, he/she will find that the few existing forest inventory textbooks, though some with merit, either use confusing statistical symbols or do not adequately cover theoretical principles.
Hinweis: Dieser Artikel kann nur an eine deutsche Lieferadresse ausgeliefert werden.
Hinweis: Dieser Artikel kann nur an eine deutsche Lieferadresse ausgeliefert werden.
Produktdetails
- Produktdetails
- Verlag: Springer / Springer Berlin Heidelberg / Springer, Berlin
- Artikelnr. des Verlages: 978-3-540-17066-2
- 1986.
- Seitenzahl: 412
- Erscheinungstermin: 1. November 1986
- Englisch
- Abmessung: 244mm x 170mm x 23mm
- Gewicht: 694g
- ISBN-13: 9783540170662
- ISBN-10: 3540170669
- Artikelnr.: 25274024
- Herstellerkennzeichnung
- Books on Demand GmbH
- In de Tarpen 42
- 22848 Norderstedt
- info@bod.de
- 040 53433511
1 Simple Random Sampling without Replacement.- 1.1 Introduction.- 1.2 Expected Value. Estimators for Population Mean and Total.- 1.3 Population and Sample Variance.- 1.4 Variances of Estimated Population Mean and Total.- 1.5 Confidence Interval and Confidence Statement.- 1.6 Estimation of Proportions.- 1.7 Required Sample Size.- 1.8 Some General Remarks on Sample Plots.- 1.9 Numerical Examples.- 2 Stratified Random Sampling.- 2.1 Introduction.- 2.2 Unbiased Estimators for Population Mean and Total. Variances.- 2.3 Some Special Cases.- 2.4 Optimization of the Sampling Scheme.- 2.5 Confidence Intervals. Behrens-Fisher Problem.- 2.6 Gain in Precision Relative to Simple Random Sampling.- 2.7 Numerical Examples.- 3 Ratio Estimators in Simple Random Sampling.- 3.1 Introduction. Population Ratio. Ratio Estimators for Total and Mean.- 3.2 Variances.- 3.3 Confidence Interval. Precision versus SRS. Required Sample Size.- 3.4 Bias of the Ratio Estimator.- 3.5 Ratio Estimator per Species Group in Mixed Forest.- 3.6 Numerical Example.- 3.7 Combining Results of Different Samples to Obtain New Information.- 4 Ratio Estimators in Stratified Random Sampling.- 4.1 Introduction.- 4.2 The Separate Ratio Estimator.- 4.3 The Combined Ratio Estimator.- 4.4 Illustrations.- 4.5 Numerical Example.- 5 Regression Estimator.- 5.1 Introduction.- 5.2 Unbiased Estimator of Population Regression Line from Sample Data.- 5.3 Linear Regression Estimator and its Variance.- 5.4 Regression Estimator in Stratified Random Sampling.- 5.5 Numerical Example.- 6 Two-Phase Sampling or Double Sampling.- 6.1 Introduction.- 6.2 The Ratio Estimator in Double Sampling.- 6.2.1 Ratio Estimator in Double Sampling - Dependent Phases.- 6.2.2 Ratio Estimator in Double Sampling - Independent Phases.- 6.3 The RegressionEstimator in Double Sampling.- 6.3.1 Regression Estimator in Double Sampling - Independent Phases.- 6.3.2 Regression Estimator in Double Sampling - Dependent Phases..- 6.3.3 Numerical Example - Dependent Phases.- 6.4 Optimization in Double Sampling with Ratio and Regression Estimators.- 6.5 Double Sampling for Stratification.- 6.5.1 Introduction.- 6.5.2 Unbiased Estimator for Population Mean. Variance Expression.- 6.5.3 Variance Estimator.- 6.5.4 Optimization of the Sampling Scheme.- 6.5.5 Numerical Example.- 6.6 Correction for Misinterpretation in Estimating Stratum Proportions from Aerial Photographs.- 6.6.1 Derivation of Formulas.- 6.6.2 Numerical Example.- 6.7 Volume Estimation with Correction for Misinterpretation.- 6.7.1 Derivation of Formulas.- 6.7.2 Numerical Example.- 7 Continuous Forest Inventory with Partial Replacement of Sample Plots.- 7.1 Introduction.- 7.2 Definition of Symbols.- 7.3 Most Precise Unbiased Linear Estimator for Population Mean on the Second Occasion.- 7.4 Optimization of Sampling for Current Estimate.- 7.5 Estimation of Change (Growth or Drain).- 7.6 A Compromise Sampling Scheme.- 7.7 Numerical Example.- 8 Single- and More-Stage Cluster Sampling.- 8.1 Introduction.- 8.2 Estimators in Two-Stage Sampling.- 8.2.1 Definition of Symbols.- 8.2.2 Unbiased Estimators for Population Total and Mean per SU.- 8.2.3 Unbiased Estimators in Special Cases.- 8.2.3.1 Single-Stage Cluster Sampling.- 8.2.3.2 Primary Units of Equal Size.- 8.2.3.3 Equal Within-Cluster Variances.- 8.2.3.4 Relation to Stratified Random Sampling.- 8.2.4 Ratio Estimator for Population Total and Mean per SU.- 8.3 Optimization of the Two-Stage Sampling Scheme.- 8.4 Three- and More-Stage Sampling.- 8.5 Numerical Example of Two-Stage Sampling.- 9 Single-Stage Cluster Sampling asa Research Tool.- 9.1. Introduction.- 9.2. Intracluster Correlation Coefficient.- 9.3. Variance and Intracluster Correlation.- 9.4. Measures of Heterogeneity.- 9.4.1. The Intracluster Correlation Coefficient.- 9.4.2. The C-Index.- 9.4.3. The Index of Dispersion.- 9.4.4. Numerical Example.- 9.5. Intracluster Correlation Coefficient in Terms of Anova Quantities.- 9.6. About the Optimum Sample Plot Size.- 10 Area Estimation with Systematic Dot Grids.- 10.1. Random Sampling with n Points.- 10.2. Systematic Sampling with n Points.- 10.3. Numerical Example.- 11 Sampling with Circular Plots.- 11.1. Sampling from a Fixed Grid of Squares.- 11.2. Sampling from a Population of Fixed Circles.- 11.3. Sampling with Floating Circular Plots.- 11.4. Comparison of Variances.- 12 Point Sampling.- 12.1. General Estimator.- 12.2. Specific Estimators.- 12.3. Variances.- 12.4. Sampling Near the Stand Margin.- 12.5. Required Sample Size. Choice of K. Questionable Trees.- 12.6. Numerical Example.- 12.7. A More General View at PPS-Sampling, wtr.- 13 Line Intersect Sampling.- 13.1. Introduction.- 13.2. BUFFON's Needle Problem and Related Cases.- 13.3. Total-Estimator Based on One-line Data.- 13.4. Variance in Case of One-Line Data.- 13.5. Sampling with More Than One Line.- 13.6. Required Number and Length of Transects.- 13.7. Estimating Properties of Residual Logs in Exploited Areas.- 13.8. Estimators Based on Circular Elements.- 13.8.1. Generalization of STRAND's Estimator.- 13.8.2. Density Estimation of Mobile Animal Populations.- 13.8.3. Biomass Estimation in Arid Regions.- 13.9. Bias in Oriented Needle Populations.- 13.10. Generalization of LIS Theory.- 13.10.1. KENDALL Projection and Expected Number of Intersections.- 13.10.2. General LIS Estimator and its Variance.- 13.10.3.Applications.- 13.11. Line Intersect Subsampling.- 14 List Sampling.- 14.1. Introduction.- 14.2. Estimation of Population Total. Variance.- 14.3. Optimum Measure of Size. Comparison with Simple Random Sampling..- 14.4. Numerical Example.- 14.5. Two-Stage List Sampling.- 15 3-P Sampling.- 15.1. Introduction.- 15.2. The Principle of 3-P Sampling.- 15.3. Variance and Expected Value of Sample Size and its Inverse.- 15.4. Considerations about the Sample Size.- 15.5. GROSENBAUGH's 3-P Estimators.- 15.6. Summary and Conclusions.- 15.7. Numerical Example.- 15.8. List of Equivalent Symbols.- 1. A Family of Sampling Schemes.- 2. Permutations, Variations, Combinations.- 3. Stochastic Variables.- 3.1. Stochastic Variables in General. Normal and Standard Norm. Variable.- 3.2. The Chi-Suare Distribution.- 3.3. STUDENT's t-Distribution.- 3.4. FISHER's F-Distribution.- 4. Stochastic Vectors and Some of their Applications.- App1.2. Distribution of the Pooled Variance in Stratified R. S..- App1.3. Analysis of Variance in Stratified Random Sampling.- App1.4. Analysis of Variance in 2-Stage Sampling.- Appl.5. Proof of STEIN's Method for Estimating Required Sample size.- 5. Covariance, Correlation, Regression.- 6. The LAGRANGE Multiplier Method of Optimization.- 7. Expected Value and Variance in Multivariate Distributions.- 8. Hypergeometric, Multinomial and Binomial Distributions.- 9. The Most Precise Unbiased Linear Estimator of a Parameter X, based on a Number of Independent Unbiased Estimates of Different Precision.- 10. Variance Formulas for Sums, Differences, Products and Ratios.- 11. The Random Forest (POISSON FOREST).- 12. Derivation of the Identity used in List Sampling.- 13. Expanding a Function in a TAYLOR Series.- 14. About Double Sums.- 15. Exercises.- References.
1 Simple Random Sampling without Replacement.- 1.1 Introduction.- 1.2 Expected Value. Estimators for Population Mean and Total.- 1.3 Population and Sample Variance.- 1.4 Variances of Estimated Population Mean and Total.- 1.5 Confidence Interval and Confidence Statement.- 1.6 Estimation of Proportions.- 1.7 Required Sample Size.- 1.8 Some General Remarks on Sample Plots.- 1.9 Numerical Examples.- 2 Stratified Random Sampling.- 2.1 Introduction.- 2.2 Unbiased Estimators for Population Mean and Total. Variances.- 2.3 Some Special Cases.- 2.4 Optimization of the Sampling Scheme.- 2.5 Confidence Intervals. Behrens-Fisher Problem.- 2.6 Gain in Precision Relative to Simple Random Sampling.- 2.7 Numerical Examples.- 3 Ratio Estimators in Simple Random Sampling.- 3.1 Introduction. Population Ratio. Ratio Estimators for Total and Mean.- 3.2 Variances.- 3.3 Confidence Interval. Precision versus SRS. Required Sample Size.- 3.4 Bias of the Ratio Estimator.- 3.5 Ratio Estimator per Species Group in Mixed Forest.- 3.6 Numerical Example.- 3.7 Combining Results of Different Samples to Obtain New Information.- 4 Ratio Estimators in Stratified Random Sampling.- 4.1 Introduction.- 4.2 The Separate Ratio Estimator.- 4.3 The Combined Ratio Estimator.- 4.4 Illustrations.- 4.5 Numerical Example.- 5 Regression Estimator.- 5.1 Introduction.- 5.2 Unbiased Estimator of Population Regression Line from Sample Data.- 5.3 Linear Regression Estimator and its Variance.- 5.4 Regression Estimator in Stratified Random Sampling.- 5.5 Numerical Example.- 6 Two-Phase Sampling or Double Sampling.- 6.1 Introduction.- 6.2 The Ratio Estimator in Double Sampling.- 6.2.1 Ratio Estimator in Double Sampling - Dependent Phases.- 6.2.2 Ratio Estimator in Double Sampling - Independent Phases.- 6.3 The RegressionEstimator in Double Sampling.- 6.3.1 Regression Estimator in Double Sampling - Independent Phases.- 6.3.2 Regression Estimator in Double Sampling - Dependent Phases..- 6.3.3 Numerical Example - Dependent Phases.- 6.4 Optimization in Double Sampling with Ratio and Regression Estimators.- 6.5 Double Sampling for Stratification.- 6.5.1 Introduction.- 6.5.2 Unbiased Estimator for Population Mean. Variance Expression.- 6.5.3 Variance Estimator.- 6.5.4 Optimization of the Sampling Scheme.- 6.5.5 Numerical Example.- 6.6 Correction for Misinterpretation in Estimating Stratum Proportions from Aerial Photographs.- 6.6.1 Derivation of Formulas.- 6.6.2 Numerical Example.- 6.7 Volume Estimation with Correction for Misinterpretation.- 6.7.1 Derivation of Formulas.- 6.7.2 Numerical Example.- 7 Continuous Forest Inventory with Partial Replacement of Sample Plots.- 7.1 Introduction.- 7.2 Definition of Symbols.- 7.3 Most Precise Unbiased Linear Estimator for Population Mean on the Second Occasion.- 7.4 Optimization of Sampling for Current Estimate.- 7.5 Estimation of Change (Growth or Drain).- 7.6 A Compromise Sampling Scheme.- 7.7 Numerical Example.- 8 Single- and More-Stage Cluster Sampling.- 8.1 Introduction.- 8.2 Estimators in Two-Stage Sampling.- 8.2.1 Definition of Symbols.- 8.2.2 Unbiased Estimators for Population Total and Mean per SU.- 8.2.3 Unbiased Estimators in Special Cases.- 8.2.3.1 Single-Stage Cluster Sampling.- 8.2.3.2 Primary Units of Equal Size.- 8.2.3.3 Equal Within-Cluster Variances.- 8.2.3.4 Relation to Stratified Random Sampling.- 8.2.4 Ratio Estimator for Population Total and Mean per SU.- 8.3 Optimization of the Two-Stage Sampling Scheme.- 8.4 Three- and More-Stage Sampling.- 8.5 Numerical Example of Two-Stage Sampling.- 9 Single-Stage Cluster Sampling asa Research Tool.- 9.1. Introduction.- 9.2. Intracluster Correlation Coefficient.- 9.3. Variance and Intracluster Correlation.- 9.4. Measures of Heterogeneity.- 9.4.1. The Intracluster Correlation Coefficient.- 9.4.2. The C-Index.- 9.4.3. The Index of Dispersion.- 9.4.4. Numerical Example.- 9.5. Intracluster Correlation Coefficient in Terms of Anova Quantities.- 9.6. About the Optimum Sample Plot Size.- 10 Area Estimation with Systematic Dot Grids.- 10.1. Random Sampling with n Points.- 10.2. Systematic Sampling with n Points.- 10.3. Numerical Example.- 11 Sampling with Circular Plots.- 11.1. Sampling from a Fixed Grid of Squares.- 11.2. Sampling from a Population of Fixed Circles.- 11.3. Sampling with Floating Circular Plots.- 11.4. Comparison of Variances.- 12 Point Sampling.- 12.1. General Estimator.- 12.2. Specific Estimators.- 12.3. Variances.- 12.4. Sampling Near the Stand Margin.- 12.5. Required Sample Size. Choice of K. Questionable Trees.- 12.6. Numerical Example.- 12.7. A More General View at PPS-Sampling, wtr.- 13 Line Intersect Sampling.- 13.1. Introduction.- 13.2. BUFFON's Needle Problem and Related Cases.- 13.3. Total-Estimator Based on One-line Data.- 13.4. Variance in Case of One-Line Data.- 13.5. Sampling with More Than One Line.- 13.6. Required Number and Length of Transects.- 13.7. Estimating Properties of Residual Logs in Exploited Areas.- 13.8. Estimators Based on Circular Elements.- 13.8.1. Generalization of STRAND's Estimator.- 13.8.2. Density Estimation of Mobile Animal Populations.- 13.8.3. Biomass Estimation in Arid Regions.- 13.9. Bias in Oriented Needle Populations.- 13.10. Generalization of LIS Theory.- 13.10.1. KENDALL Projection and Expected Number of Intersections.- 13.10.2. General LIS Estimator and its Variance.- 13.10.3.Applications.- 13.11. Line Intersect Subsampling.- 14 List Sampling.- 14.1. Introduction.- 14.2. Estimation of Population Total. Variance.- 14.3. Optimum Measure of Size. Comparison with Simple Random Sampling..- 14.4. Numerical Example.- 14.5. Two-Stage List Sampling.- 15 3-P Sampling.- 15.1. Introduction.- 15.2. The Principle of 3-P Sampling.- 15.3. Variance and Expected Value of Sample Size and its Inverse.- 15.4. Considerations about the Sample Size.- 15.5. GROSENBAUGH's 3-P Estimators.- 15.6. Summary and Conclusions.- 15.7. Numerical Example.- 15.8. List of Equivalent Symbols.- 1. A Family of Sampling Schemes.- 2. Permutations, Variations, Combinations.- 3. Stochastic Variables.- 3.1. Stochastic Variables in General. Normal and Standard Norm. Variable.- 3.2. The Chi-Suare Distribution.- 3.3. STUDENT's t-Distribution.- 3.4. FISHER's F-Distribution.- 4. Stochastic Vectors and Some of their Applications.- App1.2. Distribution of the Pooled Variance in Stratified R. S..- App1.3. Analysis of Variance in Stratified Random Sampling.- App1.4. Analysis of Variance in 2-Stage Sampling.- Appl.5. Proof of STEIN's Method for Estimating Required Sample size.- 5. Covariance, Correlation, Regression.- 6. The LAGRANGE Multiplier Method of Optimization.- 7. Expected Value and Variance in Multivariate Distributions.- 8. Hypergeometric, Multinomial and Binomial Distributions.- 9. The Most Precise Unbiased Linear Estimator of a Parameter X, based on a Number of Independent Unbiased Estimates of Different Precision.- 10. Variance Formulas for Sums, Differences, Products and Ratios.- 11. The Random Forest (POISSON FOREST).- 12. Derivation of the Identity used in List Sampling.- 13. Expanding a Function in a TAYLOR Series.- 14. About Double Sums.- 15. Exercises.- References.

