G. Robin Henderson
Six Sigma Quality Improvement with Minitab
G. Robin Henderson
Six Sigma Quality Improvement with Minitab
- Broschiertes Buch
- Merkliste
- Auf die Merkliste
- Bewerten Bewerten
- Teilen
- Produkt teilen
- Produkterinnerung
- Produkterinnerung
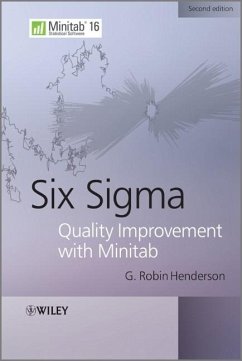
A practical resource, this second edition of the book offers a clear understanding of and the implementation of statistical methods fundamental to the Six Sigma approach to the continuous improvement of products, processes and services. It demonstrates key statistical methods in the application of the Six Sigma methodology and their implementation via the widely used statistical software package Minitab. The book includes: Pareto charts and on Cause-and Effect diagrams; Time-weighted control charts - moving, average, CUSUM and EWMA; Multivariate control charts - an introduction; Acceptance…mehr
Andere Kunden interessierten sich auch für
- G. Robin HendersonSix Sigma Quality Improvement with Minitab153,99 €
- Thomas P. RyanQuality Improvement 3E167,99 €
- Francis GiesbrechtPlanning, Construction, and Statistical Analysis of Comparative Experiments242,99 €
- Mikel HarryPractitioner's Guide to Statistics and Lean Six SIGMA for Process Improvements209,99 €
- Kalimuthu KrishnamoorthyStatistical Tolerance Regions184,99 €
- George E P BoxStatistical Control by Monitoring and Adjustment160,99 €
- Thomas P. RyanModern Experimental Design212,99 €
-
-
-
A practical resource, this second edition of the book offers a clear understanding of and the implementation of statistical methods fundamental to the Six Sigma approach to the continuous improvement of products, processes and services. It demonstrates key statistical methods in the application of the Six Sigma methodology and their implementation via the widely used statistical software package Minitab. The book includes: Pareto charts and on Cause-and Effect diagrams; Time-weighted control charts - moving, average, CUSUM and EWMA; Multivariate control charts - an introduction; Acceptance sampling by attributes and variables; Tests of association using the chi-square distribution; Logistic regression; and Taguchi experimental designs.
This book aims to enable readers to understand and implement, via the widely used statistical software package Minitab (Release 16), statistical methods fundamental to the Six Sigma approach to the continuous improvement of products, processes and services.
The second edition includes the following new material:
Pareto charts and Cause-and-Effect diagrams
Time-weighted control charts cumulative sum (CUSUM) and exponentially weighted moving average (EWMA)
Multivariate control charts
Acceptance sampling by attributes and variables (not provided in Release 14)
Tests of association using the chi-square distribution
Logistic regression
Taguchi experimental designs
Hinweis: Dieser Artikel kann nur an eine deutsche Lieferadresse ausgeliefert werden.
This book aims to enable readers to understand and implement, via the widely used statistical software package Minitab (Release 16), statistical methods fundamental to the Six Sigma approach to the continuous improvement of products, processes and services.
The second edition includes the following new material:
Pareto charts and Cause-and-Effect diagrams
Time-weighted control charts cumulative sum (CUSUM) and exponentially weighted moving average (EWMA)
Multivariate control charts
Acceptance sampling by attributes and variables (not provided in Release 14)
Tests of association using the chi-square distribution
Logistic regression
Taguchi experimental designs
Hinweis: Dieser Artikel kann nur an eine deutsche Lieferadresse ausgeliefert werden.
Produktdetails
- Produktdetails
- Verlag: Wiley & Sons
- 2. Aufl.
- Seitenzahl: 528
- Erscheinungstermin: 22. August 2011
- Englisch
- Abmessung: 251mm x 172mm x 30mm
- Gewicht: 885g
- ISBN-13: 9780470741740
- ISBN-10: 0470741740
- Artikelnr.: 33352723
- Herstellerkennzeichnung
- Libri GmbH
- Europaallee 1
- 36244 Bad Hersfeld
- 06621 890
G. Robin Henderson, Statistical Consultant, Halcro Consultancy.
Foreword.
Preface.
Acknowledgements.
About the Author.
1 Introduction.
1.1 Quality and Quality Improvement.
1.2 Six Sigma Quality Improvement.
1.3 The Six Sigma Roadmap and DMAIC.
1.4 The Role of Statistical Methods in Six Sigma.
1.5 Minitab and its Role in the Implementation of Statistical Methods.
1.6 Exercises and Follow-Up Activities.
2 Data Display, Summary and Manipulation.
2.1 The Run Chart - a First Minitab Session.
2.1.1 Input of Data Via Keyboard and Creation of a Run Chart in Minitab.
2.1.2 Minitab Projects and Their Components.
2.2 Display and Summary of Univariate Data.
2.2.1 Histogram and Distribution.
2.2.2 Shape of a Distribution.
2.2.3 Location.
2.2.4 Variability.
2.3 Data Input, Output, Manipulation and Management.
2.3.1 Data Input and Output.
2.3.2 Stacking and Unstacking of Data; Changing Data Type and Coding.
2.3.3 Case Study Demonstrating Ranking, Sorting and Extraction of
Information from Date/Time Data.
2.4 Exercises and Follow-Up Activities.
3 Exploratory Data Analysis, Display and Summary of Multivariate Data.
3.1 Exploratory Data Analysis.
3.1.1 Stem-and-Leaf Displays.
3.1.2 Outliers and Outlier Detection.
3.1.3 Boxplots.
3.1.4 Brushing.
3.2 Display and Summary of Bivariate and Multivariate Data.
3.2.1 Bivariate Data - Scatterplots and Marginal Plots.
3.2.2 Covariance and Correlation.
3.2.3 Multivariate Data - Matrix Plots.
3.2.4 Multi-Vari Charts.
3.3 Other Displays.
3.3.1 Pareto Charts.
3.3.2 Cause-and-Effect Diagrams.
3.4 Exercises and Follow-Up Activities.
4 Statistical Models.
4.1 Fundamentals of Probability.
4.1.1 Concept and Notation.
4.1.2 Rules for Probabilities.
4.2 Probability Distributions for Counts and Measurements.
4.2.1 Binomial Distribution.
4.2.2 Poisson Distribution.
4.2.3 Normal (Gaussian) Distribution.
4.3 Distribution of Means and Proportions.
4.3.1 Two Preliminary Results.
4.3.2 Distribution of the Sample Mean.
4.3.3 Distribution of the Sample Proportion.
4.4 Multivariate Normal Distribution.
4.5 Statistical Models Applied to Acceptance Sampling.
4.5.1 Acceptance Sampling by Attributes.
4.5.2 Acceptance Sampling by Variables.
4.6 Exercises and Follow-Up Activities.
5 Control Charts.
5.1 Shewhart Charts for Measurement Data.
5.1.1 I and MR Charts for Individual Measurements.
5.1.2 Tests for Evidence of Special Cause Variation on Shewhart Charts.
5.1.3 Xbar and R Charts for Samples (Subgroups) of Measurements.
5.2 Shewhart Charts for Attribute Data.
5.2.1 P Chart for Proportion Nonconforming.
5.2.2 NP Chart for Number Nonconforming.
5.2.3 C Chart for Count of Nonconformities.
5.2.4 U Chart for Nonconformities Per Unit.
5.2.5 Funnel Plots.
5.3 Time-Weighted Control Charts.
5.3.1 Moving Averages and their Applications.
5.3.2 Exponentially Weighted Moving Average Control Charts.
5.3.3 Cumulative Sum Control Charts.
5.4 Process Adjustment.
5.4.1 Process Tampering.
5.4.2 Autocorrelated Data and Process Feedback Adjustment.
5.5 Multivariate Control Charts.
5.6 Exercises and Follow-Up Activities.
6 Process Capability Analysis.
6.1 Process Capability.
6.1.1 Process Capability Analysis with Measurement Data.
6.1.2 Process Capability Indices and Sigma Quality Levels.
6.1.3 Process Capability Analysis with Nonnormal Data.
6.1.4 Tolerance Intervals.
6.1.5 Process Capability Analysis with Attribute Data.
6.2 Exercises and Follow-Up Activities.
7 Process Experimentation with a Single Factor.
7.1 Fundamentals of Hypothesis Testing.
7.2 Tests and Confidence Intervals for the Comparison of Means and
Proportions with a Standard.
7.2.1 Tests Based on the Standard Normal Distribution - z-Tests.
7.2.2 Tests Based on the Student t-Distribution - t-Tests.
7.2.3 Tests for Proportions.
7.2.4 Nonparametric Sign and Wilcoxon Tests.
7.3 Tests and Confidence Intervals for the Comparison of Two Means or Two
Proportions.
7.3.1 Two-Sample t-Tests.
7.3.2 Tests for Two Proportions.
7.3.3 Nonparametric Mann-Whitney Test.
7.4 The Analysis of Paired Data - t-Tests and Sign Tests.
7.5 Experiments with a Single Factor Having More Than Two Levels.
7.5.1 Design and Analysis of a Single-Factor Experiment.
7.5.2 The Fixed Effects Model.
7.5.3 The Random Effects Model.
7.5.4 The Nonparametric Kruskal-Wallis Test.
7.6 Blocking in Single-Factor Experiments.
7.7 Experiments with a Single Factor, with More Than Two Levels, where the
Response is a Proportion.
7.8 Tests for Equality of Variances.
7.9 Exercises and Follow-Up Activities.
8 Process Experimentation with Two or More Factors.
8.1 General Factorial Experiments.
8.1.1 Creation of a General Factorial Experimental Design.
8.1.2 Display and Analysis of Data from a General Factorial Experiment.
8.1.3 The Fixed Effects Model, Comparisons.
8.1.4 The Random Effects Model, Components of Variance.
8.2 Full Factorial Experiments in the 2k Series.
8.2.1 22 Factorial Experimental Designs, Display and Analysis of Data.
8.2.2 Models and Associated Displays.
8.2.3 Examples of 23 and 24 Experiments, the Use of Pareto and Normal
Probability Plots of Effects.
8.3 Fractional Factorial Experiments in the 2k-p Series.
8.3.1 Introduction to Fractional Factorial Experiments, Confounding and
Resolution.
8.3.2 Case Study Examples.
8.4 Taguchi Experimental Designs.
8.5 Exercises and Follow-Up Activities.
9 Evaluation of Measurement Processes.
9.1 Measurement Process Concepts.
9.1.1 Bias, Linearity, Repeatability and Reproducibility.
9.1.2 Inadequate Measurement Units.
9.2 Gauge Repeatability and Reproducibility Studies.
9.3 Comparison of Measurement Systems.
9.4 Attribute Scenarios.
9.5 Exercises and Follow-Up Activities.
10 Regression and Model Building.
10.1 Regression with a Single Predictor Variable.
10.2 Multiple Regression.
10.3 Response Surface Methods.
10.4 Categorical Data and Logistic Regression.
10.4.1 Tests of Association Using the Chi-Square Distribution.
10.4.2 Binary Logistic Regression.
10.5 Exercises and Follow-Up Activities.
11 Learning More and Further Minitab.
11.1 Learning More about Minitab and Obtaining Help.
11.1.1 Meet Minitab.
11.1.2 Help.
11.1.3 StatGuide.
11.1.4 Tutorials.
11.1.5 Assistant.
11.1.6 Glossary, Methods and Formulas.
11.1.7 Minitab on the Web and Knowledgebase/FAQ.
11.2 Macros.
11.2.1 Minitab Session Commands.
11.2.2 Global and Local Minitab Macros.
11.3 Further Features of Minitab.
11.4 Quality Companion.
11.5 Postscript.
Appendix 1.
Appendix 2.
Appendix 3.
Appendix 4.
References.
Index.