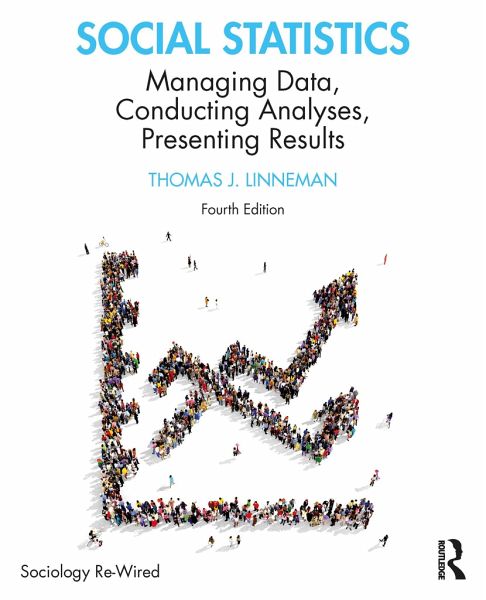
This new edition covers the contemporary statistical techniques that students will encounter in the world of social research at an introductory level. Recurrent examples using four timely topics - health, immigration, income inequality, and everyday harassment - help students understand how these techniques.
This new edition covers the contemporary statistical techniques that students will encounter in the world of social research at an introductory level. Recurrent examples using four timely topics - health, immigration, income inequality, and everyday harassment - help students understand how these techniques.Hinweis: Dieser Artikel kann nur an eine deutsche Lieferadresse ausgeliefert werden.
Thomas J. Linneman is Professor of Sociology and Faculty Director of Academic Advising at the College of William & Mary. The recipient of several teaching awards, he teaches statistics, social change, sexualities, and the pandemic. His research on teaching statistics recently appeared in the journal Teaching Sociology. After a student posted one of his teaching videos on TikTok and it went viral, a Buzzfeed list named him "Best Professor on the Planet."
Inhaltsangabe
Preface Acknowledgements Chapter 1. Life in a Data-Laden Age: Finding and Managing Datasets Chapter 2. The Art of Visual Storytelling: Creating Accurate Tables and Graphs Chapter 3. Summarizing Center and Diversity: Basic Descriptive Statistics Chapter 4. Using Sample Crosstabs to Talk About Populations: The Chi-square Test Chapter 5. Using a Sample Mean or Proportion to Talk About a Population: Confidence Intervals Chapter 6. Using Multiple Sample Means to Talk About Populations: T-Tests and ANOVA Chapter 7. Give me One Good Reason Why: Bivariate Correlation and Regression Chapter 8. Using Sample Slopes to Talk About Populations: Inference and Regression Chapter 9. It's All Relative: Dichotomies as Independent Variables in Regression Chapter 10. Above and Beyond: The Logic of Controlling and the Power of Nested Regression Models Chapter 11. Some Slopes are Bigger than Others: Calculating and Interpreting Beta Coefficients Chapter 12. Different Slopes for Different Folks: Interaction Effects Chapter 13. Explaining Dichotomous Outcomes: Logistic Regression Chapter 14. Visualizing Causal Stories: Path Analysis Chapter 15. Questioning the Greatness of Straightness: Nonlinear Relationships Chapter 16. Problems and Prospects: Regression Diagnostics, Advanced Techniques, and Where to Go Now Appendix A: Variables and Indexes from the Datasets Used in the End-of-Chapter Exercises Appendix B: 100 Articles That Use Statistics in Less than Scary Ways Appendix C: Statistical Tables Appendix D: Answers to Odd-Numbered End-of-Chapter Exercises Bibliography Glossary/Index
Es gelten unsere Allgemeinen Geschäftsbedingungen: www.buecher.de/agb
Impressum
www.buecher.de ist ein Internetauftritt der buecher.de internetstores GmbH
Geschäftsführung: Monica Sawhney | Roland Kölbl | Günter Hilger
Sitz der Gesellschaft: Batheyer Straße 115 - 117, 58099 Hagen
Postanschrift: Bürgermeister-Wegele-Str. 12, 86167 Augsburg
Amtsgericht Hagen HRB 13257
Steuernummer: 321/5800/1497
USt-IdNr: DE450055826