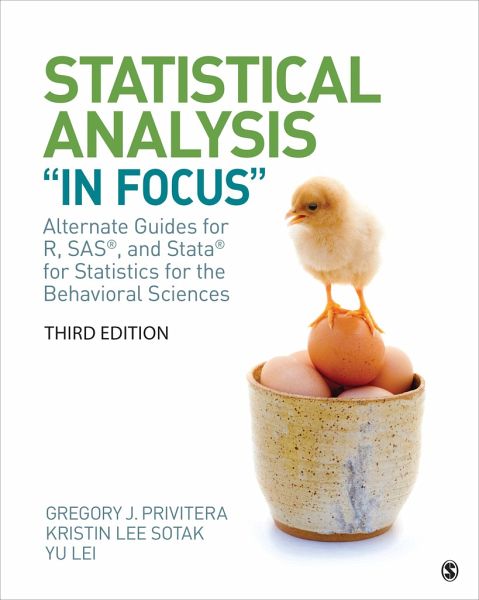
Statistical Analysis in Focus
Alternate Guides for R, Sas, and Stata for Statistics for the Behavioral Sciences
Statistical Analysis in Focus
Alternate Guides for R, Sas, and Stata for Statistics for the Behavioral Sciences
- Broschiertes Buch
- Merkliste
- Auf die Merkliste
- Bewerten Bewerten
- Teilen
- Produkt teilen
- Produkterinnerung
- Produkterinnerung
Third EditionStatistics for the Behavioral Sciences, Third Edition who work with a statistical program other than SPSS or Excel. Three standalone parts, each dedicated to R, SAS, and Stata, serve as step-by-step guides for completing the "In Focus" exercises in Privitera’s core text. Gregory J. Privitera, Kristin Lee Sotak, and Yu Lei’s conversational writing style along with "To The Student" introductions allow students to familiarize themselves and become more comfortable with each program prior to making computations. Additionally, General Instruction Guidebook (GIG) sections for R, SAS,…mehr
- Gregory J PriviteraEssential Statistics for the Behavioral Sciences190,99 €
- The Structure of Schooling190,99 €
- Christiane HofHandeln und Forschen19,90 €
- Exceptional Outcomes:79,99 €
- Prue ChamberlayneThe Turn to Biographical Methods in Social Science94,99 €
- Kirsten Schlegel-MatthiesKonsum - Ernährung - Gesundheit31,90 €
- Stephan KielblockKompass quantitative Forschung24,00 €
-
-
-
Hinweis: Dieser Artikel kann nur an eine deutsche Lieferadresse ausgeliefert werden.
- Produktdetails
- Verlag: Sage Publications
- 3rd edition
- Seitenzahl: 280
- Erscheinungstermin: 5. Januar 2018
- Englisch
- Abmessung: 251mm x 198mm x 15mm
- Gewicht: 522g
- ISBN-13: 9781544305608
- ISBN-10: 1544305605
- Artikelnr.: 48967300
- Verlag: Sage Publications
- 3rd edition
- Seitenzahl: 280
- Erscheinungstermin: 5. Januar 2018
- Englisch
- Abmessung: 251mm x 198mm x 15mm
- Gewicht: 522g
- ISBN-13: 9781544305608
- ISBN-10: 1544305605
- Artikelnr.: 48967300
About This Supplemental Guide
PART I. ANALYSIS IN FOCUS: R
To the Student-How to Use R With This Book
R in Focus
1.7 Entering and Defining Variables (p. 23)
2.4 Frequency Distributions for Quantitative Data (p. 46)
2.7 Frequency Distributions for Categorical Data (p. 51)
2.12 Histograms, Bar Charts, and Pie Charts (p. 65)
3.6 Mean, Median, and Mode (p. 98)
4.11 Range, Variance, and Standard Deviation (p. 129)
5.6 Probability Tables (p. 152)
6.8 Converting Raw Scores to Standard z Scores (p. 193)
7.7 Estimating the Standard Error of the Mean (p. 227)
9.6 One-Sample t Test (p. 286)
9.9 Two-Independent-Sample t Test (p. 297)
10.4 The Related-Samples t Test (p. 317)
11.5 Confidence Intervals for the One-Sample t Test (p. 347)
11.7 Confidence Intervals for the Two-Independent-Sample t Test (p. 350)
11.9 Confidence Intervals for the Related-Samples t Test (p. 353)
12.8 The One-Way Between-Subjects ANOVA (p. 389)
13.6 The One-Way Within-Subjects ANOVA (p. 423)
14.8 The Two-Way Between-Subjects ANOVA (p. 474)
15.4 Pearson Correlation Coefficient (p. 501)
15.8 Spearman Correlation Coefficient (p. 512)
15.10 Point-Biserial Correlation Coefficient (p. 517)
15.12 Phi Correlation Coefficient (p. 522)
16.7 Analysis of Regression (p. 551)
16.13 Multiple Regression Analysis (p. 566)
17.3 The Chi-Square Goodness-of-Fit Test (p. 586)
17.9 The Chi-Square Test for Independence (p. 601)
18.3 The Related-Samples Sign Test (p. 621)
18.5 The Wilcoxon Signed-Ranks T Test (p. 626)
18.7 The Mann-Whitney U Test (p. 632)
18.9 The Kruskal-Wallis H Test (p. 637)
18.11 The Friedman Test (p. 641)
General Instruction Guide
PART II. ANALYSIS IN FOCUS: SAS
To the Student-How to Use SAS With This Book
SAS in Focus
1.7 Entering and Defining Variables (p. 23)
2.4 Frequency Distributions for Quantitative Data (p. 46)
2.7 Frequency Distributions for Categorical Data (p. 51)
2.12 Histograms, Bar Charts, and Pie Charts (p. 65)
3.6 Mean, Median, and Mode (p. 98)
4.11 Range, Variance, and Standard Deviation (p. 129)
5.6 Probability Tables (p. 152)
6.8 Converting Raw Scores to Standard z Scores (p. 193)
7.7 Estimating the Standard Error of the Mean (p. 227)
9.6 One-Sample t Test (p. 286)
9.9 Two-Independent-Sample t Test (p. 297)
10.4 The Related-Samples t Test (p. 317)
11.5 Confidence Intervals for the One-Sample t Test (p. 347)
11.7 Confidence Intervals for the Two-Independent-Sample t Test (p. 350)
11.9 Confidence Intervals for the Related-Samples t Test (p. 353)
12.8 The One-Way Between-Subjects ANOVA (p. 389)
13.6 The One-Way Within-Subjects ANOVA (p. 423)
14.8 The Two-Way Between-Subjects ANOVA (p. 474)
15.4 Pearson Correlation Coefficient (p. 501)
15.8 Spearman Correlation Coefficient (p. 512)
15.10 Point-Biserial Correlation Coefficient (p. 517)
15.12 Phi Correlation Coefficient (p. 522)
16.7 Analysis of Regression (p. 551)
16.13 Multiple Regression Analysis (p. 566)
17.3 The Chi-Square Goodness-of-Fit Test (p. 586)
17.9 The Chi-Square Test for Independence (p. 601)
18.3 The Related-Samples Sign Test (p. 621)
18.5 The Wilcoxon Signed-Ranks T Test (p. 626)
18.7 The Mann-Whitney U Test (p. 632)
18.9 The Kruskal-Wallis H Test (p. 637)
18.11 The Friedman Test (p. 641)
General Instruction Guide
PART III. ANALYSIS IN FOCUS: STATA
To the Student-How to Use Stata With This Book
Stata in Focus
1.7 Entering and Defining Variables (p. 23)
2.4 Frequency Distributions for Quantitative Data (p. 46)
2.7 Frequency Distributions for Categorical Data (p. 51)
2.12 Histograms, Bar Charts, and Pie Charts (p. 65)
3.6 Mean, Median, and Mode (p. 98)
4.11 Range, Variance, and Standard Deviation (p. 129)
5.6 Probability Tables (p. 152)
6.8 Converting Raw Scores to Standard z Scores (p. 193)
7.7 Estimating the Standard Error of the Mean (p. 227)
9.6 One-Sample t Test (p. 286)
9.9 Two-Independent-Sample t Test (p. 297)
10.4 The Related-Samples t Test (p. 317)
11.5 Confidence Intervals for the One-Sample t Test (p. 347)
11.7 Confidence Intervals for the Two-Independent-Sample t Test (p. 350)
11.9 Confidence Intervals for the Related-Samples t Test (p. 353)
12.8 The One-Way Between-Subjects ANOVA (p. 389)
13.6 The One-Way Within-Subjects ANOVA (p. 423)
14.8 The Two-Way Between-Subjects ANOVA (p. 474)
15.4 Pearson Correlation Coefficient (p. 501)
15.8 Spearman Correlation Coefficient (p. 512)
15.10 Point-Biserial Correlation Coefficient (p. 517)
15.12 Phi Correlation Coefficient (p. 522)
16.7 Analysis of Regression (p. 551)
16.13 Multiple Regression Analysis (p. 566)
17.3 The Chi-Square Goodness-of-Fit Test (p. 586)
17.9 The Chi-Square Test for Independence (p. 601)
18.3 The Related-Samples Sign Test (p. 621)
18.5 The Wilcoxon Signed-Ranks T Test (p. 626)
18.7 The Mann-Whitney U Test (p. 632)
18.9 The Kruskal-Wallis H Test (p. 637)
18.11 The Friedman Test (p. 641)
General Instruction Guide
References
Index