- Gebundenes Buch
- Merkliste
- Auf die Merkliste
- Bewerten Bewerten
- Teilen
- Produkt teilen
- Produkterinnerung
- Produkterinnerung
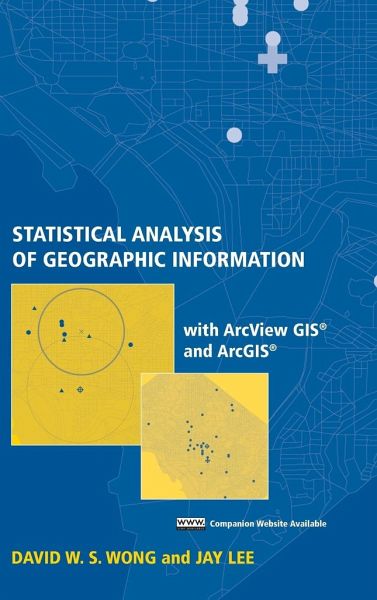
Statistical Analysis and Modeling of Geographic Information with ArcView GIS is an update to Lee and Wong s Statistical Analysis with ArcView GIS, featuring expanded coverage of classical statistical methods, probability and statistical testing, new student exercises to facilitate classroom use, new exercises featuring interactive ArcView Avenue scripts, and a new overview of compatible spatial analytical functions in ArcGIS 9.0.
Andere Kunden interessierten sich auch für
- Tor BernhardsenGeographic Information Systems153,99 €
- Anne Vernez Moudon / Michael Hubner (Hgg.)Monitoring Land Supply with Geographic Information Systems190,99 €
- John Stillwell / Graham Clarke (Hgg.)Applied GIS and Spatial Analysis235,99 €
- Nicholas ChrismanExploring Geographic Information Systems250,99 €
- Jacek MalczewskiGIS and Multicriteria Decision Analysis205,99 €
- Zhong-Ren PengInternet GIS178,99 €
- Jeff ThurstonIntegrated Geospatial Technologies154,99 €
-
-
-
Statistical Analysis and Modeling of Geographic Information with ArcView GIS is an update to Lee and Wong s Statistical Analysis with ArcView GIS, featuring expanded coverage of classical statistical methods, probability and statistical testing, new student exercises to facilitate classroom use, new exercises featuring interactive ArcView Avenue scripts, and a new overview of compatible spatial analytical functions in ArcGIS 9.0.
Hinweis: Dieser Artikel kann nur an eine deutsche Lieferadresse ausgeliefert werden.
Produktdetails
- Produktdetails
- Verlag: Wiley & Sons
- Artikelnr. des Verlages: 14646899000
- 1. Auflage
- Seitenzahl: 464
- Erscheinungstermin: 1. Oktober 2005
- Englisch
- Abmessung: 240mm x 161mm x 29mm
- Gewicht: 770g
- ISBN-13: 9780471468998
- ISBN-10: 0471468991
- Artikelnr.: 15181391
- Herstellerkennzeichnung
- Produktsicherheitsverantwortliche/r
- Europaallee 1
- 36244 Bad Hersfeld
- gpsr@libri.de
David W. S. Wong, PhD, is Professor and Chair of the Earth Systems and GeoInformation Sciences Program at George Mason University in Fairfax, Virginia. Jay Lee, PhD, is Professor and Chair of the Department of Geography at Kent State University in Kent, Ohio.
PREFACE.
ACKNOWLEDGMENTS.
1 INTRODUCTION.
1.1 Why Statistics and Sampling?
1.2 What Are Special about Spatial Data?
1.3 Spatial Data and the Need for Spatial Analysis/ Statistics.
1.4 Fundamentals of Spatial Analysis and Statistics.
1.5 ArcView Notes-Data Model and Examples.
PART I: CLASSICAL STATISTICS.
2 DISTRIBUTION DESCRIPTORS: ONE VARIABLE (UNIVARIATE).
2.1 Measures of Central Tendency.
2.2 Measures of Dispersion.
2.3 ArcView Examples.
2.4 Higher Moment Statistics.
2.5 ArcView Examples.
2.6 Application Example.
2.7 Summary.
3 RELATIONSHIP DESCRIPTORS: TWO VARIABLES (BIVARIATE).
3.1 Correlation Analysis.
3.2 Correlation: Nominal Scale.
3.3 Correlation: Ordinal Scale.
3.4 Correlation: Interval /Ratio Scale.
3.5 Trend Analysis.
3.6 ArcView Notes.
3.7 Application Examples.
4 HYPOTHESIS TESTERS.
4.1 Probability Concepts.
4.2 Probability Functions.
4.3 Central Limit Theorem and Confidence Intervals.
4.4 Hypothesis Testing.
4.5 Parametric Test Statistics.
4.6 Difference in Means.
4.7 Difference Between a Mean and a Fixed Value.
4.8 Significance of Pearson's Correlation Coefficient.
4.9 Significance of Regression Parameters.
4.10 Testing Nonparametric Statistics.
4.11 Summary.
PART II: SPATIAL STATISTICS.
5 POINT PATTERN DESCRIPTORS.
5.1 The Nature of Point Features.
5.2 Central Tendency of Point Distributions.
5.3 Dispersion and Orientation of Point Distributions.
5.4 ArcView Notes.
5.5 Application Examples.
6 POINT PATTERN ANALYZERS.
6.1 Scale and Extent.
6.2 Quadrat Analysis.
6.3 Ordered Neighbor Analysis.
6.4 K-Function.
6.5 Spatial Autocorrelation of Points.
6.6 Application Examples.
7 LINE PATTERN ANALYZERS.
7.1 The Nature of Linear Features: Vectors and Networks.
7.2 Characteristics and Attributes of Linear Features.
7.3 Directional Statistics.
7.4 Network Analysis.
7.5 Application Examples.
8 POLYGON PATTERN ANALYZERS.
8.1 Introduction.
8.2 Spatial Relationships.
8.3 Spatial Dependency.
8.4 Spatial Weights Matrices.
8.5 Spatial Autocorrelation Statistics and Notations.
8.6 Joint Count Statistics.
8.7 Spatial Autocorrelation Global Statistics.
8.8 Local Spatial Autocorrelation Statistics.
8.9 Moran Scatterplot.
8.10 Bivariate Spatial Autocorrelation.
8.11 Application Examples.
8.12 Summary.
APPENDIX: ArcGIS Spatial Statistics Tools.
ABOUT THE CD-ROM.
INDEX.