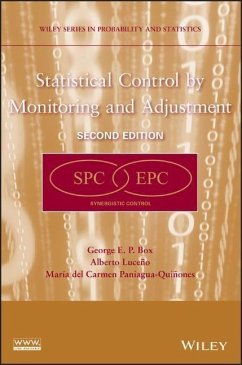
George E P Box, Alberto Luceño, Maria Del Carmen Paniagua-Quinones
Statistical Control by Monitoring and Adjustment
George E P Box, Alberto Luceño, Maria Del Carmen Paniagua-Quinones
Statistical Control by Monitoring and Adjustment
- Broschiertes Buch
- Merkliste
- Auf die Merkliste
- Bewerten Bewerten
- Teilen
- Produkt teilen
- Produkterinnerung
- Produkterinnerung
Praise for the First Edition "This book . . . is a significant addition to the literature on statistical practice . . . should be of considerable interest to those interested in these topics."--International Journal of Forecasting Recent research has shown that monitoring techniques alone are inadequate for modern Statistical Process Control (SPC), and there exists a need for these techniques to be augmented by methods that indicate when occasional process adjustment is necessary. Statistical Control by Monitoring and Adjustment, Second Edition presents the relationship among these concepts…mehr
Andere Kunden interessierten sich auch für
![Quality Improvement 3E Quality Improvement 3E]() Thomas P. RyanQuality Improvement 3E144,99 €
Thomas P. RyanQuality Improvement 3E144,99 €![Planning, Construction, and Statistical Analysis of Comparative Experiments Planning, Construction, and Statistical Analysis of Comparative Experiments]() Francis GiesbrechtPlanning, Construction, and Statistical Analysis of Comparative Experiments208,99 €
Francis GiesbrechtPlanning, Construction, and Statistical Analysis of Comparative Experiments208,99 €![Approximate Dynamic Programmin Approximate Dynamic Programmin]() Warren Buckler PowellApproximate Dynamic Programmin142,99 €
Warren Buckler PowellApproximate Dynamic Programmin142,99 €![Probabilistic Reliability Models Probabilistic Reliability Models]() Igor A. UshakovProbabilistic Reliability Models107,99 €
Igor A. UshakovProbabilistic Reliability Models107,99 €![Six Sigma Quality Improvement with Minitab Six Sigma Quality Improvement with Minitab]() G. Robin HendersonSix Sigma Quality Improvement with Minitab70,99 €
G. Robin HendersonSix Sigma Quality Improvement with Minitab70,99 €![Six Sigma Quality Improvement with Minitab Six Sigma Quality Improvement with Minitab]() G. Robin HendersonSix Sigma Quality Improvement with Minitab132,99 €
G. Robin HendersonSix Sigma Quality Improvement with Minitab132,99 €![Statistical Process Adjustment for Quality Control Statistical Process Adjustment for Quality Control]() Enrique Del CastilloStatistical Process Adjustment for Quality Control204,99 €
Enrique Del CastilloStatistical Process Adjustment for Quality Control204,99 €-
-
-
Praise for the First Edition "This book . . . is a significant addition to the literature on statistical practice . . . should be of considerable interest to those interested in these topics."--International Journal of Forecasting Recent research has shown that monitoring techniques alone are inadequate for modern Statistical Process Control (SPC), and there exists a need for these techniques to be augmented by methods that indicate when occasional process adjustment is necessary. Statistical Control by Monitoring and Adjustment, Second Edition presents the relationship among these concepts and elementary ideas from Engineering Process Control (EPC), demonstrating how the powerful synergistic association between SPC and EPC can solve numerous problems that are frequently encountered in process monitoring and adjustment. The book begins with a discussion of SPC as it was originally conceived by Dr. Walter A. Shewhart and Dr. W. Edwards Deming. Subsequent chapters outline the basics of the new integration of SPC and EPC, which is not available in other related books. Thorough coverage of time series analysis for forecasting, process dynamics, and non-stationary models is also provided, and these sections have been carefully written so as to require only an elementary understanding of mathematics. Extensive graphical explanations and computational tables accompany the numerous examples that are provided throughout each chapter, and a helpful selection of problems and solutions further facilitates understanding. Statistical Control by Monitoring and Adjustment, Second Edition is an excellent book for courses on applied statistics and industrial engineering at the upper-undergraduate and graduate levels. It also serves as a valuable reference for statisticians and quality control practitioners working in industry.
Produktdetails
- Produktdetails
- Verlag: John Wiley & Sons / Wiley
- 2nd edition
- Seitenzahl: 368
- Erscheinungstermin: 1. April 2009
- Englisch
- Abmessung: 231mm x 155mm x 20mm
- Gewicht: 499g
- ISBN-13: 9780470148327
- ISBN-10: 0470148322
- Artikelnr.: 25933447
- Herstellerkennzeichnung
- Libri GmbH
- Europaallee 1
- 36244 Bad Hersfeld
- gpsr@libri.de
GEORGE E. P. BOX, PHD, is Ronald Aylmer Fisher Professor Emeritus of Statistics and Industrial Engineering at the University of Wisconsin?Madison. He is a Fellow of the Royal Society of London and the American Academy of Arts and Sciences. He is an honorary Fellow and Shewart and Deming Medalist of the American Society for Quality and an honorary member of the International Statistical Institute. He is also the recipient of the Samuel S. Wilks Memorial Medal of the American Statistical Association and the Guy Medal in Gold of the Royal Statistical Society. Dr. Box is the coauthor of Statistics for Experimenters: Design, Innovation, and Discovery, Second Edition; Response Surfaces, Mixtures, and Ridge Analyses, Second Edition; Evolutionary Operation: A Statistical Method for Process Improvements; Improving Almost Anything: Ideas and Essays, Revised Edition; Time Series Analysis: Forecasting and Control, Fourth Edition; and Bayesian Interface and Statistical Analyses, all published by Wiley. ALBERTO LUCEÑO, PHD, is Professor in the ETS de Ingenieros de Caminos at the University of Cantabria, Spain. He is an Associate Editor of the Journal of Quality Technology and Statistical Modelling: An International Journal. MARÍA DEL CARMEN PANIAGUA-QUIÑONES, PHD, is Visiting Assistant Professor in the School of Industrial Engineering at Purdue University. Her research interests include experimental design, quality productivity, and engineering management and control process improvement. She was the recipient of the Brumbaugh Award of the American Society for Quality for Best Technical Paper in 2007.
Preface xi 1 Introduction and Revision of Some Statistical Ideas 1 1.1 Necessity for Process Control 1 1.2 SPC and EPC 1 1.3 Process Monitoring Without a Model 3 1.4 Detecting a Signal in Noise 4 1.5 Measurement Data 4 1.6 Two Important Characteristics of a Probability Distribution 5 1.7 Normal Distribution 6 1.8 Normal Distribution Defined by
and
6 1.9 Probabilities Associated with Normal Distribution 7 1.10 Estimating Mean and Standard Deviation from Data 8 1.11 Combining Estimates of
2 9 1.12 Data on Frequencies (Events): Poisson Distribution 10 1.13 Normal Approximation to Poisson Distribution 12 1.14 Data on Proportion Defective: Binomial Distribution 12 1.15 Normal Approximation to Binomial Distribution 14 Appendix 1A: Central Limit Effect 15 Problems 17 2 Standard Control Charts Under Ideal Conditions As a First Approximation 21 2.1 Control Charts for Process Monitoring 21 2.2 Control Chart for Measurement (Variables) Data 22 2.3 Shewhart Charts for Sample Average and Range 24 2.4 Shewhart Chart for Sample Range 26 2.5 Process Monitoring With Control Charts for Frequencies 29 2.6 Data on Frequencies (Counts): Poisson Distribution 30 2.7 Common Causes and Special Causes 34 2.8 For What Kinds of Data Has the c Chart Been Used? 36 2.9 Quality Control Charts for Proportions: p Chart 37 2.10 EWMA Chart 40 2.11 Process Monitoring Using Cumulative Sums 46 2.12 Specification Limits, Target Accuracy, and Process Capability 53 2.13 How Successful Process Monitoring can Improve Quality 56 Problems 57 3 What Can Go Wrong and What Can We Do About It? 61 3.1 Introduction 61 3.2 Measurement Charts 64 3.3 Need for Time Series Models 65 3.4 Types of Variation 65 3.5 Nonstationary Noise 66 3.6 Values for constants 71 3.7 Frequencies and Proportions 74 3.8 Illustration 76 3.9 Robustness of EWMA 78 Appendix 3A: Alternative Forms of Relationships for EWMAs 79 Questions 79 4 Introduction to Forecasting and Process Dynamics 81 4.1 Forecasting with an EWMA 81 4.2 Forecasting Sales of Dingles 82 4.3 Pete's Rule 85 4.4 Effect of Changing Discount Factor 86 4.5 Estimating Best Discount Factor 87 4.6 Standard Deviation of Forecast Errors and Probability Limits for Forecasts 88 4.7 What to Do If You Do Not Have Enough Data to Estimate
89 4.8 Introduction to Process Dynamics and Transfer Function 89 4.9 Dynamic Systems and Transfer Funtions 90 4.10 Difference Equations to Represent Dynamic Relations 90 4.11 Representing Dynamics of Industrial Process 96 4.12 Transfer Function Models Using Difference Equations 97 4.13 Stable and Unstable Systems 98 Problems 100 5 Nonstationary Time Series Models for Process Disturbances 103 5.1 Reprise 103 5.2 Stationary Time Series Model in Which Successive Values are Correlated 104 5.3 Major Effects of Statistical Dependence: Illustration 105 5.4 Random Walk 106 5.5 How to Test a Forecasting Method 107 5.6 Qualification of EWMA as a Forecast 107 5.7 Understanding Time Series Behavior with Variogram 110 5.8 Sticky Innovation Generating Model for Nonstationary Noise 113 5.9 Robustness of EWMA for Signal Extraction 118 5.10 Signal Extraction for Disturbance Model Due to Barnard 118 Questions 122 Problems 122 6 Repeated-Feedback Adjustment 125 6.1 Introduction to Discrete-Feedback Control 125 6.2 Inadequacy of NIID Models and Other Stationary Models for Control: Reiteration 125 6.3 Three Approaches to Repeated-Feedback Adjustment that Lead to Identical Conclusions 126 6.4 Some History 130 6.5 Adjustment Chart 132 6.6 Insensitivity to Choice of G 134 6.7 Compromise Value for G 135 6.8 Using Smaller Value of G to Reduce Adjustment Variance
2x 136 Appendix 6A: Robustness of Integral Control 137 Appendix 6B: Effect on Adjustment of Choosing G Different from
0: Obtaining Equation (6.12) 139 Appendix 6C: Average Reduction in Mean-Square Error Due to Adjustment for Observations Generated by IMA Model 140 Questions 140 Problems 140 7 Periodic Adjustment 143 7.1 Introduction 143 7.2 Periodic Adjustment 143 7.3 Starting Scheme for Periodic Adjustment 146 7.4 Numerical Calculations for Bounded Adjustment 146 7.5 Simple Device for Facilitating Bounded Adjustment 150 7.6 Bounded Adjustment Seen as Process of Tracking 153 7.7 Combination of Adjustment and Monitoring 153 7.8 Bounded Adjustment for Series not Generated by IMA Model 155 Problems 160 8 Control of Process with Inertia 163 8.1 Adjustment Depending on Last Two Output Errors 163 8.2 Minimum Mean-Square Error Control of Process With First-Order Dynamics 167 8.3 Schemes with Constrained Adjustment 169 8.4 PI Schemes with Constrained Adjustment 170 8.5 Optimal and Near-Optimal Constrained PI Schemes: Choice of P 171 8.6 Choice of G For P = 0 and P =
0.25 172 8.7 PI Schemes for Process With Dead Time 178 8.8 Process Monitoring and Process Adjustment 181 8.9 Feedback Adjustment Applied to Process in Perfect State of Control 182 8.10 Using Shewhart Chart to Adjust Unstable Process 182 8.11 Feedforward Control 183 Appendix 8A: Equivalence of Equations for PI Control 184 Appendix 8B: Effect of Errors in Adjustment 184 Appendix 8C: Choices for G and P to Attain Optimal Constrained PI Control for Various Values of
0 and
0 with d0 = 0 and d0 = 1 185 Questions 191 Problems 191 9 Explicit Consideration of Monetary Cost 193 9.1 Introduction 193 9.2 How Often Should You Take Data? 197 9.3 Choosing Adjustment Schemes Directly in Terms of Costs 203 Appendix 9A: Functions h(L/
a) and q(L/
a) in Table 9.1 205 Appendix 9B: Calculation of Minimum-Cost Schemes 205 Problems 207 10 Cuscore Charts: Looking for Signals in Noise 209 10.1 Introduction 209 10.2 How Are Cuscore Statistics Obtained? 216 10.3 Efficient Monitoring Charts 219 10.4 Useful Method for Obtaining Detector When Looking for Signal in Noise Not Necessarily White Noise 221 10.5 Looking for Single Spike 223 10.6 Some Time Series Examples 224 Appendix 10A: Likelihood, Fisher's Efficient Score, and Cuscore Statistics 227 Appendix 10B: Useful Procedure for Obtaining Appropriate Cuscore Statistic 230 Appendix 10C: Detector Series for IMA Model 231 Problems 231 11 Monitoring an Operating Feedback System 235 11.1 Looking for Spike in Disturbance zt Subjected to Integral Control 235 11.2 Looking for Exponential Signal in Disturbance Subject to Integral Control 237 11.3 Monitoring Process with Inertia Represented by First-Order Dynamics 238 11.4 Reconstructing Disturbance Pattern 240 Appendix 11A: Derivation of Equation (11.3) 240 Appendix 11B: Derivation of Equation (11.10) 242 Appendix 11C: Derivation of Equation (11.14) 243 12 Brief Review of Time Series Analysis 245 12.1 Serial Dependence: Autocorrelation Function and Variogram 245 12.2 Relation of Autocorrelation Function and Variogram 246 12.3 Some Time Series Models 247 12.4 Stationary Models 247 12.5 Autoregressive Moving-Average Models 250 12.6 Nonstationary Models 253 12.7 IMA [or ARIMA(0, 1, 1)] Model 253 12.8 Modeling Time Series Data 255 12.9 Model Identification, Model Fitting, and Diagnostic Checking 256 12.10 Forecasting 261 12.11 Estimation with Closed-Loop Data 266 12.12 Conclusion 269 Appendix 12A: Other Tools for Identification of Time Series Models 269 Appendix 12B: Estimation of Time Series Parameters 270 Solutions to Exercises and Problems 273 References and Further Reading 307 Appendix Three Time Series 321 Index 327

