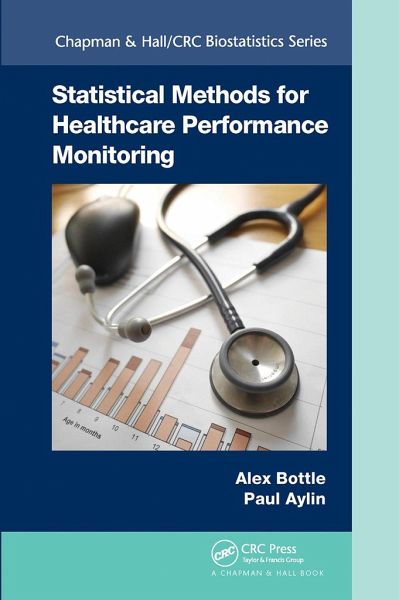
Healthcare is important to everyone, yet large variations in its quality have been well documented both between and within many countries. With demand and expenditure rising, it's more crucial than ever to know how well the healthcare system and all its components - from staff member to regional network - are performing. This requires data, which inevitably differ in form and quality. It also requires statistical methods, the output of which needs to be presented so that it can be understood by whoever needs it to make decisions. Statistical Methods for Healthcare Performance Monitoring covers…mehr
Healthcare is important to everyone, yet large variations in its quality have been well documented both between and within many countries. With demand and expenditure rising, it's more crucial than ever to know how well the healthcare system and all its components - from staff member to regional network - are performing. This requires data, which inevitably differ in form and quality. It also requires statistical methods, the output of which needs to be presented so that it can be understood by whoever needs it to make decisions. Statistical Methods for Healthcare Performance Monitoring covers measuring quality, types of data, risk adjustment, defining good and bad performance, statistical monitoring, presenting the results to different audiences and evaluating the monitoring system itself. Using examples from around the world, it brings all the issues and perspectives together in a largely non-technical way for clinicians, managers and methodologists. Statistical Methods for Healthcare Performance Monitoring is aimed at statisticians and researchers who need to know how to measure and compare performance, health service regulators, health service managers with responsibilities for monitoring performance, and quality improvement scientists, including those involved in clinical audits.Hinweis: Dieser Artikel kann nur an eine deutsche Lieferadresse ausgeliefert werden.
Dr. Alex Bottle is a Senior Lecturer at Imperial College London, UK Dr. Paul Aylin is a Professor at Imperial College London, UK
Inhaltsangabe
Introduction The need for performance monitoring Measuring and monitoring quality The need for this book Who is this book for and how should it be used? Common abbreviations used in the book Acknowledgments Origins and examples of monitoring systemsOrigins Healthcare scandals Examples of monitoring schemes Goals of monitoring Choosing the unit of analysis and reportingIssues principally concerning the analysis Issues more relevant to reporting: attributing performance to a given unit in a system What to measure: choosing and defining indicatorsHow can we define quality? Common indicator taxonomies The particular challenges of measuring patient safety The particular challenges of multimorbidity Measuring the health of the population and quality of the whole healthcare system Efficiency and value Features of an ideal indicator Steps in construction and common issues in definition Validation of indicators Some strategies for choosing among candidates Time to go: when to withdraw indicators Conclusion Sources of dataHow to assess data quality Administrative data Clinical registry data The accuracy of administrative and clinical databases compared Indicent reports and other ways to capture safety events Surverys Other sources Other issues concering data sources Conclusion Risk-adjustment principles and methodsRisk adjustment and risk prediction When and why should we adjust for risk? Alteratives to risk adjustment What factors should be adjust for? Selecting an initial set of candidate variables Dealing with missing and extreme values Timing of the risk factor measurement Building the model Output the observed and model-predicted outcomesRatios versus differences Deriving SMRs from standardisation and logistic regression Other fixed effects approaches to generate an SMR Random effects based SMRs Marginal versus multilevel models Which is the "best" modelling approach overall? Further reading on producing risk-adjusted outcomes by unit Composite measuresSome examples Steps in the construction Some real examples Pros and cons of composites Setting performance thresholds and defining outliersDefining acceptable performance Bayesian methods for comparing providers Statistical process control and funnel plots Multiple testing Ways of assessing variation between units How much variation is "acceptable"? The impact on outlier status of using fixed versus random effects to derive SMRs How reliably can we detect poor performance? Some resources for quality improvement methods Making comparisons across national bordersExamples of multinational patient-level databases Challenges Interpreting apparent differences in performance between countries Conclusion Presenting the results to stakeholdersMain ways of presenting comparative performance data Effect on behaviour of the choice of format when providing performance data Importance of the method of presentation Examples of giving performance information to units Examples of giving performance information to the public Metadata Evaluating the monitoring systemStudy design and statistical approaches to evalutating a monitoring system Economic evaluation methods Concluding thoughtsSimple versus complex Specific versus general The future References Appendix: glossary of main statistical terms used
Es gelten unsere Allgemeinen Geschäftsbedingungen: www.buecher.de/agb
Impressum
www.buecher.de ist ein Internetauftritt der buecher.de internetstores GmbH
Geschäftsführung: Monica Sawhney | Roland Kölbl | Günter Hilger
Sitz der Gesellschaft: Batheyer Straße 115 - 117, 58099 Hagen
Postanschrift: Bürgermeister-Wegele-Str. 12, 86167 Augsburg
Amtsgericht Hagen HRB 13257
Steuernummer: 321/neu