Brett Myors, Kevin R Murphy
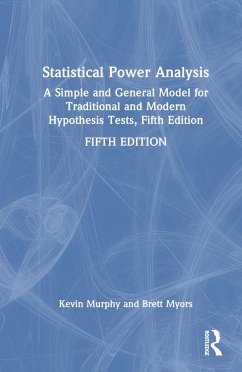
Statistical Power Analysis
A Simple and General Model for Traditional and Modern Hypothesis Tests, Fifth Edition
Brett Myors, Kevin R Murphy
Statistical Power Analysis
A Simple and General Model for Traditional and Modern Hypothesis Tests, Fifth Edition
- Gebundenes Buch
- Merkliste
- Auf die Merkliste
- Bewerten Bewerten
- Teilen
- Produkt teilen
- Produkterinnerung
- Produkterinnerung
Statistical Power Analysis explains the key concepts in statistical power analysis and illustrates their application in both tests of traditional null hypotheses. It provides readers with the tools to understand and perform power analyses for virtually all the statistical methods used in the social and behavioral sciences.
Andere Kunden interessierten sich auch für
![Introduction to the New Statistics Introduction to the New Statistics]() Geoff CummingIntroduction to the New Statistics248,99 €
Geoff CummingIntroduction to the New Statistics248,99 €![Data Analysis Data Analysis]() Charles M. JuddData Analysis198,99 €
Charles M. JuddData Analysis198,99 €![Statistical Power Analysis with Missing Data Statistical Power Analysis with Missing Data]() Adam DaveyStatistical Power Analysis with Missing Data63,99 €
Adam DaveyStatistical Power Analysis with Missing Data63,99 €![Research Design and Statistical Analysis Research Design and Statistical Analysis]() Caren M RotelloResearch Design and Statistical Analysis187,99 €
Caren M RotelloResearch Design and Statistical Analysis187,99 €![Research Design and Statistical Analysis Research Design and Statistical Analysis]() Jerome L MyersResearch Design and Statistical Analysis187,99 €
Jerome L MyersResearch Design and Statistical Analysis187,99 €![Propensity Score Analysis Propensity Score Analysis]() Propensity Score Analysis60,99 €
Propensity Score Analysis60,99 €![Empirical Direction in Design and Analysis Empirical Direction in Design and Analysis]() Norman H AndersonEmpirical Direction in Design and Analysis181,99 €
Norman H AndersonEmpirical Direction in Design and Analysis181,99 €-
-
-
Statistical Power Analysis explains the key concepts in statistical power analysis and illustrates their application in both tests of traditional null hypotheses. It provides readers with the tools to understand and perform power analyses for virtually all the statistical methods used in the social and behavioral sciences.
Hinweis: Dieser Artikel kann nur an eine deutsche Lieferadresse ausgeliefert werden.
Hinweis: Dieser Artikel kann nur an eine deutsche Lieferadresse ausgeliefert werden.
Produktdetails
- Produktdetails
- Verlag: Taylor & Francis
- 5th edition
- Seitenzahl: 224
- Erscheinungstermin: 3. März 2023
- Englisch
- Abmessung: 229mm x 152mm x 16mm
- Gewicht: 508g
- ISBN-13: 9781032283012
- ISBN-10: 1032283017
- Artikelnr.: 66726877
- Herstellerkennzeichnung
- Libri GmbH
- Europaallee 1
- 36244 Bad Hersfeld
- gpsr@libri.de
Kevin Murphy is a professor emeritus, University of Limerick, and an Organizational Psychologist. He is an author and editor of over 13 books and over 200 articles and chapters, in areas ranging from data analysis and research design to performance appraisal and performance management Brett Myors received his PhD in Psychology from University of New South Wales, with a Postdoctoral appointment at Colorado State University. He served as director of organisational psychology at Griffith University and has published methodological research in several leading journals. He currently resides in the United Kingdom.
1. The Power of Statistical Tests 1.1 The Structure of Statistical Tests
1.1.1 Null Hypotheses vs. Nil Hypotheses1.1.2 Understanding Conditional
Probability 1.2 The Mechanics of Power Analysis 1.2.1 Understanding
Sampling 1.2.2 Distributions d vs. delta vs. g 1.3 Statistical Power of
Research in the Social and Behavioral Sciences Power and the Replication
Crisis 1.4 Using Power Analysis The Meaning of Statistical Significance 1.5
Hypothesis Tests vs. Confidence Intervals Accuracy in Parameter Estimation
1.6 What Can We Learn from a Null Hypothesis Test? 1.7 Summary 2. A Simple
and General Model for Power Analysis 2.1 The General Linear Model, the F
Statistic, and Effect Size 2.1.1 Effect Size 2.2 Understanding Linear
Models 2.3 The F Distribution and Power 2.3.1 Confidence Intervals for PV
and d 2.4 Using the Noncentral F Distribution to Assess Power 2.5
Translating Common Statistics and ES Measures into F 2.5.1 Worked Example -
Hierarchical Regression 2.5.2 Worked Examples Using the d Statistic 2.6
Defining Large, Medium and Small Effects 2.7 Nonparametric and Robust
Statistics 2.8 From F to Power Analysis 2.9 Analytic and Tabular Methods of
Power Analysis 2.10 Using the One-Stop F Table 2.11 Simple and General
Software for Power Analysis 2.12 R code for Power Analysis for Traditional
and Modern Hypothesis Tests 2.13 Summary 3. Power Analyses for
Minimum-Effect Tests 3.1 Nil Hypothesis Testing 3.2 The Nil Hypothesis is
Almost Always Wrong 3.2.1 Polar Bear Traps: Why Type I Error Control is a
Bad Investment 3.3 The Nil may not be True, but it is Often Fairly Accurate
3.4 Minimum-Effect tests as Alternatives to Traditional Null Hypothesis
Tests 3.5 Sometimes a Point Hypothesis is also a Range Hypothesis 3.6 How
do you Know the Effect Size? 3.7 Testing the Hypothesis that Treatment
Effects are Negligible 3.8 Using the One-Stop Tables to Assess Power for
Minimum-Effect Tests 3.9 A Worked Example of Minimum-Effect Testing 3.10
Type I Errors in Minimum-Effect Tests 3.11 Summary 4. Using Power Analyses
4.1 Estimating the Effect Size 4.2 Using the One-Stop Tables and the R
Code/Shiny Web app to Perform Power Analyses 4.2.1 Worked Example:
Calculating F-equivalents and Power 4.3 Four Applications of Statistical
Power Analysis 4.4 Calculating Power 4.5 Determining Sample Sizes 4.6 A Few
Simple Approximations for Determining Sample Size Needed 4.7 Determining
the Sensitivity of Studies 4.8 Determining Appropriate Decision Criteria
4.8.1 Finding a Sensible Alpha 4.9 Post-Hoc Power Analysis Should be
Avoided 4.10 Summary 5. Correlation and Regression 5.1 The Perils of
Working with Large Samples 5.2 Multiple Regression 5.2.1 Testing
Minimum-Effect Hypotheses in Multiple Regression 5.3 Power in Testing for
Moderators 5.3.1 Power Analysis for Moderators 5.4 Implications of Low
Power in Tests for Moderators 5.5 If You Understand Regression, You Will
Understand (Almost) Everything 5.6 Summary 6. t-Tests and the One-Way
Analysis of Variance 6.1 The t Test 6.2 The t distribution vs the Normal
Distribution 6.3 Independent Groups t Test 6.3.1 Determining an Appropriate
Sample Size 6.4 One- Versus Two Tailed Tests 6.4.1 Re-analysis of Smoking
Reduction Treatments: One-Tailed Tests 6.5 Repeated Measures or Dependent t
Test 6.6 The Analysis of Variance 6.6.1 Retrieving Effect Size Information
from F Ratios 6.7 Which Means Differ? 6.8 Designing a One-way ANOVA Study
6.9 Summary 7. Multi-Factor ANOVA Designs 7.1 The Factorial Analysis of
Variance 7.1.2 Calculating PV from F and df in Multi-Factor ANOVA: Worked
Example 7.2 Factorial ANOVA from Means and Standard Deviations 7.2.1
Reconstructing ANOVA results from descriptive statistics: A Worked Example
7.2.2 Eta squared vs. partial eta squared 7.3 General Design Principles for
Multifactor ANOVA 7.4 Fixed, Mixed and Random Models 7.5 Summary 8. Studies
with Multiple Observations for Each Subject: Repeated-Measures and
Multivariate Analyses 8.1 Randomized Block ANOVA: An Introduction to
Repeated Measures Designs 8.2 Independent Groups versus Repeated Measures
8.3 Complexities in Estimating Power in Repeated-Measures Designs 8.4 Mixed
Designs: Split Plot Factorial ANOVA 8.4.1 Estimating Power for a Split Plot
Factorial ANOVA 8.5 Power for Within-Subject vs. Between-Subject Factors
8.6 Split-Plot Designs with Multiple Repeated-Measures Factors 8.7 The
Multivariate Analysis of Variance 8.8 Summary 9. Power Analysis for
Multilevel Studies 9.1 What do Multilevel Analyses Tell You? 9.2 The
Multilevel Equation 9.3 Are Multilevel Models Necessary? - The Intraclass
Correlation 9.4 An Illustration of Multilevel Analysis 9.5 Remember, It's
All Regression 9.6 Effect Sizes in Multilevel Analysis 9.6.1 R code for
obtaining R2 and pseudo-R2 estimates 9.7 Power for What? 9.8 Using Changes
in Model Fit as a Basis for Power Analysis in Multilevel Modeling 9.9 R
code for calculating critical chi squared values and power for
minimum-effect comparisons of models 9.10 Sample Size - Some General
Guidance 9.11 Summary 10. The Implications of Power Analyses 10.1 Tests of
the Traditional Null Hypothesis 10.2 Tests of Minimum-Effect Hypotheses
10.2.1 Type I Errors in Minimum-Effect Tests Revisited 10.2.2 Statistical
Power and the Replication Crisis 10.3 Power Analysis: Benefits, Costs, and
Implications for Hypothesis Testing 10.4 Direct Benefits of Power Analysis
10.4.1 Is HARKing a Serious Problem? 10.5 Indirect Benefits of Power
Analysis 10.6 Costs Associated With Power Analysis 10.7 Implications of
Power Analysis: Can Power be too High? 10.8 Summary 11. Appendix A -
Translating Statistics into F and PV Values 12 Appendix B - One Stop F
Table 13. Appendix C- One Stop PV Table 14. Appendix D - dferr Needed for
Power of .80 for Nil and Minimum-Effect Hypothesis Tests

