Ram C. Bhujel
Statistics for Aquaculture
Ram C. Bhujel
Statistics for Aquaculture
- Gebundenes Buch
- Merkliste
- Auf die Merkliste
- Bewerten Bewerten
- Teilen
- Produkt teilen
- Produkterinnerung
- Produkterinnerung
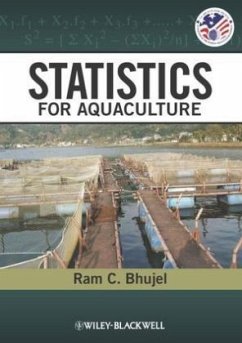
Published in cooperation with the United States Aquaculture Society A strong background in statistics is essential for researchers in any scientific field in order to design experiments, survey research, analyze data, and present findings accurately. To date, there has been no single text to address these concepts in the context of aquaculture research. Statistics for Aquaculture fills that gap by providing user-friendly coverage of statistical principles and methods geared specifically toward the aquaculture community.
Statistics for Aquaculture begins with an introduction to basic…mehr
Andere Kunden interessierten sich auch für
![Handbook of Microalgal Culture Handbook of Microalgal Culture]() Amos RichmondHandbook of Microalgal Culture619,99 €
Amos RichmondHandbook of Microalgal Culture619,99 €![Functional Genomics in Aquaculture Functional Genomics in Aquaculture]() Marco SarogliaFunctional Genomics in Aquaculture259,99 €
Marco SarogliaFunctional Genomics in Aquaculture259,99 €![Practical Flatfish Culture and Stock Enhancement Practical Flatfish Culture and Stock Enhancement]() Practical Flatfish Culture and Stock Enhancement297,99 €
Practical Flatfish Culture and Stock Enhancement297,99 €![Methods for the Study of Marine Benthos Methods for the Study of Marine Benthos]() Methods for the Study of Marine Benthos243,99 €
Methods for the Study of Marine Benthos243,99 €![Sparidae Sparidae]() Sparidae282,99 €
Sparidae282,99 €![Aquaculture Production Systems Aquaculture Production Systems]() James H. TidwellAquaculture Production Systems124,99 €
James H. TidwellAquaculture Production Systems124,99 €![Dietary Nutrients, Additives and Fish Health Dietary Nutrients, Additives and Fish Health]() Cheng-Sheng LeeDietary Nutrients, Additives and Fish Health234,99 €
Cheng-Sheng LeeDietary Nutrients, Additives and Fish Health234,99 €-
-
-
Published in cooperation with the United States Aquaculture Society
A strong background in statistics is essential for researchers in any scientific field in order to design experiments, survey research, analyze data, and present findings accurately. To date, there has been no single text to address these concepts in the context of aquaculture research. Statistics for Aquaculture fills that gap by providing user-friendly coverage of statistical principles and methods geared specifically toward the aquaculture community.
Statistics for Aquaculture begins with an introduction to basic concepts such as experimental units and data collection, transitions through the fundamentals of experimental design and hypothesis formulation, and culminates with a discussion of experimental analysis and advanced topics in the latest research. Well-illustrated with examples from around the world, each chapter ends with practical exercises to better apply the information covered.
Statistics for Aquaculture is a must-have title for students, researchers, professors, and industry personnel alike. Applicable as an introduction to aquaculture or a valuable refresher, this textbook is the first of its kind in this field.
Hinweis: Dieser Artikel kann nur an eine deutsche Lieferadresse ausgeliefert werden.
Produktdetails
- Produktdetails
- Verlag: Wiley & Sons
- 1. Auflage
- Seitenzahl: 240
- Erscheinungstermin: 1. Februar 2009
- Englisch
- Abmessung: 249mm x 193mm x 18mm
- Gewicht: 698g
- ISBN-13: 9780813815879
- ISBN-10: 0813815878
- Artikelnr.: 25626579
- Herstellerkennzeichnung
- Libri GmbH
- Europaallee 1
- 36244 Bad Hersfeld
- gpsr@libri.de
Ram C. Bhujel is Senior Research Scientist and Affiliated Faculty in the Aquaculture and Aquatic Resources Field of Study at the Asian Institute of Technology (AIT) based near Bangkok, Thailand.
Preface xi
The Society Preface xiii
Acknowledgments xv
1 Introduction 1
1.1 Background 1
1.2 History and definition of statistics 3
1.3 Scope and application 5
1.3.1 In general 5
1.3.2 In aquaculture 6
1.4 Questions 7
1.5 Practical exercise 7
2 Experimental units in aquaculture 9
2.1 Background 9
2.2 Earth ponds 9
2.3 Hapas and cages in ponds 10
2.4 Cages in lakes or reservoirs 12
2.5 Tanks 12
2.6 Aquaria 12
2.7 Farmer's field: participatory research 14
2.8 Conclusion 16
2.9 Questions 17
2.10 Practical exercises 17
3 Sampling and data collection 19
3.1 Sampling principles and methods 19
3.2 Parameters or variables 20
3.2.1 Variable types 21
3.2.2 Variables of aquaculture 21
3.3 Fish sampling 24
3.4 Sampling of feed and feed ingredients 24
3.5 Water sampling and monitoring 25
3.6 Sampling of eggs, muscles, blood, and others 26
3.7 Sample size (volume/number) 27
3.7.1 Simple method for sample size estimation 28
3.7.2 Comprehensive method for sample size estimation 29
3.7.3 Sample size estimation for survey research 30
3.8 Questions 31
3.9 Practical exercises 31
4 Data accuracy and exploratory analysis 33
4.1 Importance 33
4.2 Data accuracy and precision 33
4.3 Significant numbers 34
4.4 Errors and their sources 35
4.4.1 Gross errors 35
4.4.2 Systematic errors 36
4.4.3 Random or residual errors (unsystematic) 36
4.5 Error minimization and separation 36
4.5.1 Experimental conditions and procedures 36
4.5.2 Materials, methods, and equipment 36
4.5.3 Randomization 37
4.5.4 Pairing 38
4.5.5 Blocking 38
4.5.6 Measurement of additional variables/factors 38
4.5.7 Increasing number of treatments and replication 38
4.6 Exploratory data analysis 39
4.6.1 Checking for any errors 40
4.6.2 Comparison with others 40
4.6.3 Useful tools 40
4.6.4 Basic assumptions 41
4.7 Normal distribution 42
4.7.1 Concept of probability 43
4.7.2 Frequency distribution and probability 44
4.7.3 Grouping classes 46
4.7.4 Histogram and frequency curves 46
4.7.5 Variance heterogeneity 47
4.7.6 Data transformation 49
4.8 Questions 51
4.9 Practical exercises 51
5 Central locations and variability 55
5.1 Concept and importance 55
5.2 Measure of central tendency 56
5.2.1 Mean 56
5.2.2 Median 58
5.2.3 Mode 60
5.2.4 Midrange and midhinge 62
5.2.5 Quartiles, percentiles, and others 63
5.3 Measure of variability 64
5.3.1 Range 64
5.3.2 Interquartile range or quartile deviation 65
5.3.3 Mean deviation 65
5.3.4 Variance and standard deviation 65
5.3.5 Population and sample variance/SD 66
5.3.6 Standard error 67
5.3.7 Coefficient of variation 68
5.3.8 Implications of variability 68
5.4 Questions 69
5.5 Practical exercises 70
6 Basics of hypothesis formulation and testing 73
6.1 Concept 73
6.2 Significance level 74
6.3 Confidence level, limits, and interval 74
6.4 Statistical and biological significance 75
6.5 Errors in hypothesis testing 76
6.6 Selection of statistical tools 77
6.7 Test of goodness-of-fit 78
6.7.1 x 2-test 79
6.7.2 One-sample K-S test 82
6.8 One- and two-sample tests 82
6.8.1 Parametric tests: t- and Z-tests 84
6.8.2 Nonparametric tests: Mann-Whitney and Wilcoxon's tests 92
6.9 Questions 96
6.10 Practical exercises 96
7 Experimental designs and analysis of variance 99
7.1 Background 99
7.2 Completely randomized design 99
7.2.1 Parametric test 101
7.2.2 Nonparametric test: Kruskal-Wallis test (H-test) 105
7.3 Randomized complete block design 108
7.3.1 Parametric test using ANOVA 109
7.3.2 Nonparametric test: Friedman test for RCBD 112
7.4 Latin square design 115
7.5 Factorial experiments 122
7.6 Questions 131
7.7 Practical exercises 131
8 Testing and exploring relationships 135
8.1 Background 135
8.2 Single-factor regression 136
8.2.1 Simple linear regression 136
8.2.2 Hypothesis testing 140
8.2.3 Nonlinear regression 142
8.2.4 Model formulation and selection 144
8.3 Multiple regression 148
8.3.1 Methods 148
8.3.2 Example 149
8.3.3 Interpretation of results 151
8.3.4 Prediction 152
8.3.5 Selection of method 153
8.4 Correlation and parametric test 153
8.5 Nonparametric tests for regression and correlation 156
8.5.1 Spearman's rank correlation 156
8.5.2 Kendall's rank correlation or Kendall's coefficient of concordance
157
8.6 Multiple correlations 159
8.7 Questions 161
8.8 Practical exercises 161
9 Advanced topics 163
9.1 Cluster analysis 163
9.1.1 Univariate cluster analysis 163
9.1.2 Multivariate cluster analysis 167
9.2 Analysis of Covariance 168
9.3 Multivariate ANOVA 173
9.4 Interpretation of results 176
9.5 Questions 179
9.6 Practical exercises 179
Appendix A 181
Appendix B 193
Bibliography 215
Webliography 217
Index 219

