Richard A. Johnson (Madison University of Wisconsin), Gouri K. Bhattacharyya (Madison University of Wisconsin)
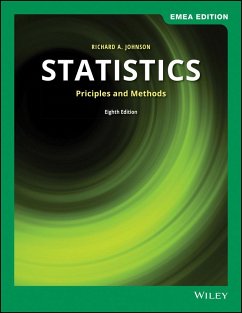
Statistics
Principles and Methods, EMEA Edition
Richard A. Johnson (Madison University of Wisconsin), Gouri K. Bhattacharyya (Madison University of Wisconsin)
Statistics
Principles and Methods, EMEA Edition
- Broschiertes Buch
- Merkliste
- Auf die Merkliste
- Bewerten Bewerten
- Teilen
- Produkt teilen
- Produkterinnerung
- Produkterinnerung
Statistics: Principles and Methods, 8th Edition provides students and business professionals with a comprehensive introduction to statistics concepts, terminology, and methods with a wide array of practical applications. Real-world data provides an easily relatable frame of reference, while numerous examples reinforce key ideas and demonstrate critical concepts to help ease student comprehension. Designed for those seeking a highly practical introduction to statistical measurement, reasoning, and analysis, this book requires no specific mathematical background and leaves derivations behind in…mehr
Andere Kunden interessierten sich auch für
![GMAT Official Guide 2024-2025 Bundle: Books + Online Question Bank GMAT Official Guide 2024-2025 Bundle: Books + Online Question Bank]() GMAC (Graduate Management Admission Council)GMAT Official Guide 2024-2025 Bundle: Books + Online Question Bank82,99 €
GMAC (Graduate Management Admission Council)GMAT Official Guide 2024-2025 Bundle: Books + Online Question Bank82,99 €![Speed Reading For Dummies Speed Reading For Dummies]() Richard SutzSpeed Reading For Dummies15,99 €
Richard SutzSpeed Reading For Dummies15,99 €![GMAT Official Guide Verbal Review 2024-2025: Book + Online Question Bank GMAT Official Guide Verbal Review 2024-2025: Book + Online Question Bank]() GMAC (Graduate Management Admission Council)GMAT Official Guide Verbal Review 2024-2025: Book + Online Question Bank26,99 €
GMAC (Graduate Management Admission Council)GMAT Official Guide Verbal Review 2024-2025: Book + Online Question Bank26,99 €![A Practical Approach to Using Statistics in Health Research A Practical Approach to Using Statistics in Health Research]() Adam Mackridge (UK Aston University in Birmingham)A Practical Approach to Using Statistics in Health Research131,99 €
Adam Mackridge (UK Aston University in Birmingham)A Practical Approach to Using Statistics in Health Research131,99 €![GED Test 5-Hour Quick Prep for Dummies GED Test 5-Hour Quick Prep for Dummies]() Tim CollinsGED Test 5-Hour Quick Prep for Dummies14,99 €
Tim CollinsGED Test 5-Hour Quick Prep for Dummies14,99 €![CCNA Certification Study Guide Volume 1, Volume 2, and Practice Tests Kit CCNA Certification Study Guide Volume 1, Volume 2, and Practice Tests Kit]() Todd LammleCCNA Certification Study Guide Volume 1, Volume 2, and Practice Tests Kit67,99 €
Todd LammleCCNA Certification Study Guide Volume 1, Volume 2, and Practice Tests Kit67,99 €![The Essential College Professor The Essential College Professor]() Jeffrey L. Buller (Mary Baldwin College)The Essential College Professor47,99 €
Jeffrey L. Buller (Mary Baldwin College)The Essential College Professor47,99 €-
-
-
Statistics: Principles and Methods, 8th Edition provides students and business professionals with a comprehensive introduction to statistics concepts, terminology, and methods with a wide array of practical applications. Real-world data provides an easily relatable frame of reference, while numerous examples reinforce key ideas and demonstrate critical concepts to help ease student comprehension. Designed for those seeking a highly practical introduction to statistical measurement, reasoning, and analysis, this book requires no specific mathematical background and leaves derivations behind in favor of logic, reasoning, and modern statistics software. Concepts are introduced first in a real-life setting to illustrate immediate relevancy, and are subsequently expanded to relate underlying mechanisms, limitations, and further applications. An emphasis on the relationship between validity and assumptions underscores the importance of critical thinking and the use of appropriate models while instilling thoughtful habits that lead to accuracy in interpretation. Going beyond the typical introductory text to keep the focus on application, this book gives students a deeper understanding of statistics as it is used every day across disciplines and industries.
Hinweis: Dieser Artikel kann nur an eine deutsche Lieferadresse ausgeliefert werden.
Hinweis: Dieser Artikel kann nur an eine deutsche Lieferadresse ausgeliefert werden.
Produktdetails
- Produktdetails
- Verlag: John Wiley & Sons Inc
- 8 ed
- Seitenzahl: 576
- Erscheinungstermin: 14. Mai 2019
- Englisch
- Abmessung: 218mm x 279mm x 36mm
- Gewicht: 1450g
- ISBN-13: 9781119588948
- ISBN-10: 1119588944
- Artikelnr.: 56875628
- Herstellerkennzeichnung
- Libri GmbH
- Europaallee 1
- 36244 Bad Hersfeld
- gpsr@libri.de
TABLE OF CONTENTS 1 INTRODUCTION TO STATISTICS 1 1 The Subject and Scope of Statistics 2 2 Statistics in Aid of Scientific Inquiry 4 3 Two Basic Concepts-Population and Sample 6 4 The Purposeful Collection of Data 11 Case Study: Statistics in Context 12 5 Objectives of Statistics 14 2 ORGANIZATION AND DESCRIPTION OF DATA 17 1 Main Types of Data 18 2 Describing Data by Tables and Graphs 19 3 Measures of Center 31 4 Measures of Variation 37 5 Checking the Stability of the Observations over Time 47 6 More on Graphics 50 Case Study: Statistics in Context 52 3 DESCRIPTIVE STUDY OF BIVARIATE DATA 64 1 Summarization of Bivariate Categorical Data 65 2 A Designed Experiment for Making a Comparison 69 3 Scatter Diagram of Bivariate Measurement Data 70 4 The Correlation Coefficient-A Measure of Linear Relation 73 5 Prediction of One Variable from another (Linear Regression) 82 4 PROBABILITY 91 1 Probability of an Event 92 2 Methods of Assigning Probability 97 3 Event Operations and Two Laws of Probability 102 4 Conditional Probability and Independence 109 5 Bayes' Theorem 117 6 Random Sampling from a Finite Population 121 Case Study: Statistics in Context 126 5 PROBABILITY DISTRIBUTIONS 134 1 Random Variables 135 2 Probability Distribution of a Discrete Random Variable 138 3 Mean (Expected Value) and Standard Deviation of a Probability Distribution 144 4 Successes and Failures-Bernoulli Trials 150 5 The Binomial Distribution 154 6 The Poisson Distribution and Rare Events 165 6 THE NORMAL DISTRIBUTION 178 1 Probability Model for a Continuous Random Variable 179 2 The Normal Distribution-Its General Features 184 3 The Standard Normal Distribution 186 4 Probability Calculations with Normal Distributions 191 5 The Normal Approximation to the Binomial 194 6 Checking the Plausibility of a Normal Model 199 7 Transforming Observations to Attain Near Normality 202 7 VARIATION IN REPEATED SAMPLES-SAMPLING DISTRIBUTIONS 210 1 The Sampling Distribution of a Statistic 212 2 Distribution of the Sample Mean and the Central Limit Theorem 218 Case Study: Statistics in Context 228 8 DRAWING INFERENCES FROM LARGE SAMPLES 235 1 Two Types of Statistical Inference: Estimation and Testing 236 2 Point Estimation of a Population Mean 238 3 Confidence Interval Estimation of a Population Mean 242 4 Testing Hypotheses about a Population Mean 250 5 Inferences about a Population Proportion 261 9 SMALL SAMPLE INFERENCES FOR NORMAL POPULATIONS 278 1 Student's t Distribution 279 2 Inferences about
-Small Sample Size 282 3 Relationship between Tests and Confidence Intervals 289 4 Inferences about the Standard Deviation
(The Chi-Square Distribution) 291 5 Robustness of Inference Procedures 296 10 COMPARING TWO TREATMENTS 303 1 Two Designs: Independent Samples and Matched Pairs Sample 305 2 Inferences about the Difference of Means-Independent Large Samples 307 3 Inferences about the Difference of Means-Independent Small Samples from Normal Populations 314 4 Randomization and Its Role in Inference 323 5 Matched Pairs Comparisons 325 6 Choosing Between Independent Samples and a Matched Pairs Sample 332 7 Comparing Two Population Proportions 333 11 REGRESSION ANALYSIS I Simple Linear Regression 349 1 Regression with a Single Predictor 350 2 A Straight Line Regression Model 353 3 The Method of Least Squares 355 4 The Sampling Variability of the Least Squares Estimators-Tools for Inference 362 5 Important Inference Problems 363 6 The Strength of a Linear Relation 373 7 Remarks about the Straight Line Model Assumptions 377 12 REGRESSION ANALYSIS II Multiple Linear Regression and Other Topics 384 1 Nonlinear Relations and Linearizing Transformations 385 2 Multiple Linear Regression 390 3 Residual Plots to Check the Adequacy of a Statistical Model 398 13 ANALYSIS OF CATEGORICAL DATA 408 1 Formulating Testing Problems Concerning Categorical Data 409 2 Pearson's
2 Test for Goodness of Fit 411 3 Contingency Table with One Margin Fixed (Test of Homogeneity) 415 4 Contingency Table with Neither Margin Fixed (Test of Independence) 422 14 ANALYSIS OF VARIANCE (ANOVA) 432 1 Comparison of Several Treatments-One-Way Analysis of Variance 433 2 Population Model and Inferences for a One-Way Analysis of Variance 439 3 Simultaneous Confidence Intervals 443 4 Graphical Diagnostics and Displays to Supplement ANOVA 446 5 Randomized Block Experiments for Comparing k Treatments 448 15 NONPARAMETRIC INFERENCE 460 1 The Wilcoxon Rank-Sum Test for Comparing Two Treatments 461 2 Matched Pairs Comparisons 469 3 Measure of Correlation Based on Ranks 475 4 Concluding Remarks 478 APPENDIX A1 SUMMATION NOTATION 483 APPENDIX A2 RULES FOR COUNTING 488 APPENDIX A3 EXPECTATION AND STANDARD DEVIATION-PROPERTIES 490 APPENDIX A4 THE EXPECTED VALUE AND STANDARD DEVIATION OF X 496 APPENDIX B TABLES 498 Table 1 Random Digits 498 Table 2 Cumulative Binomial Probabilities 501 Table 3 Cumulative Poisson Probabilities 507 Table 4 Standard Normal Probabilities 509 Table 5 Percentage Points t
of t Distributions 511 Table 6 Percentage Points
2
of
2 Distributions 512 Table 7 Percentage Points of F( v1, v2 ) Distributions 513 Table 8 Selected Tail Probabilities for the Null Distribution of Wilcoxon's Rank-Sum Statistic 515 Table 9 Selected Tail Probabilities for the Null Distribution of Wilcoxon's Signed-Rank Statistic 520 Table F1 General Formulas for Inferences about a Mean (
), Difference of Two Means (
1
2 ) 522 Table F2 Inference about Proportions 523 Summary of Formulas Useful for Exams 524 DATA BANK 530 ANSWERS TO SELECTED ODD-NUMBERED EXERCISES 544 INDEX 557

