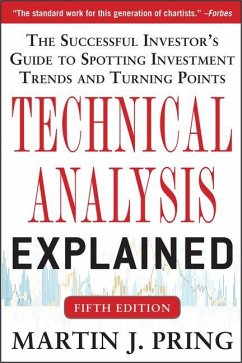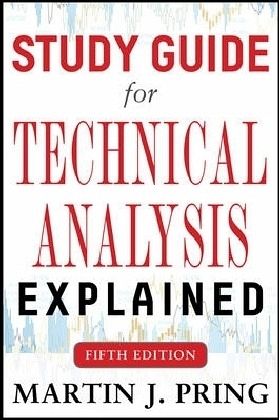
Martin Pring
Study Guide for Technical Analysis Explained Fifth Edition
Martin Pring
Study Guide for Technical Analysis Explained Fifth Edition
- Broschiertes Buch
- Merkliste
- Auf die Merkliste
- Bewerten Bewerten
- Teilen
- Produkt teilen
- Produkterinnerung
- Produkterinnerung
A guide for mastering technical analysis. It serves as your personal investing coach, taking you step-by-step through his long-proven methods.
Andere Kunden interessierten sich auch für
- Martin PringTechnical Analysis Explained, Fifth Edition: The Successful Investor's Guide to Spotting Investment Trends and Turning Points92,99 €
- Steven AchelisTechnical Analysis from A to Z, 2nd Edition44,99 €
- Jacinta ChanFinancial Times Guide to Technical Analysis, The42,99 €
- Wayne CorbittAll About Candlestick Charting35,99 €
- Greg MorrisCandlestick Charting Explained69,99 €
- Gregory MorrisCandlestick Charting Explained Workbook: Step-By-Step Exercises and Tests to Help You Master Candlestick Charting29,99 €
- Martin PringTechnical Analysis Explained, Fifth Edition: The Successful Investor's Guide to Spotting Investment Trends and Turning Points42,99 €
-
-
-
A guide for mastering technical analysis. It serves as your personal investing coach, taking you step-by-step through his long-proven methods.
Hinweis: Dieser Artikel kann nur an eine deutsche Lieferadresse ausgeliefert werden.
Produktdetails
- Produktdetails
- Verlag: McGraw-Hill Professional
- 5th Ed.
- Seitenzahl: 224
- Erscheinungstermin: 16. Februar 2014
- Englisch
- Abmessung: 228mm x 149mm x 17mm
- Gewicht: 306g
- ISBN-13: 9780071823982
- ISBN-10: 0071823980
- Artikelnr.: 38593313
- Herstellerkennzeichnung
- Libri GmbH
- Europaallee 1
- 36244 Bad Hersfeld
- 06621 890
McGraw-Hill authors represent the leading experts in their fields and are dedicated to improving the lives, careers, and interests of readers worldwide
How to Use This Study Guide 1
1 The Definition and Interaction of Trends 3
2 Financial Markets and the Business Cycle 9
3 Dow Theory 15
4 Typical Parameters for Intermediate Trends 21
5 How to Identify Support and Resistance Zones 27
6 Trendlines 33
7 Basic Characteristics of Volume 41
8 Classic Price Patterns 49
9 Smaller Price Patterns and Gaps 59
10 One- and Two-Bar Price Patterns 65
11 Moving Averages 71
12 Envelopes and Bollinger Bands 77
13 Momentum I: Basic Principles 83
14 Momentum II: Individual Indicators 91
15 Momentum III: Individual Indicators 97
16 Candlestick Charting 107
17 Point and Figure Charting 115
18 Miscellaneous Techniques for Determining Trends 119
19 The Concept of Relative Strength 127
21 Price: The Major Averages 133
22 Price: Sector Rotation 139
23 Time: Analyzing Secular Trends for Stocks,Bonds, and Commodities 145
24 Time: Cycles and Seasonal Patterns 151
25 Practical Identification of Cycles 157
26 Volume II: Volume Indicators 161
27 Market Breadth 169
28 Indicators and Relationships That Measure Confidence 175
29 The Importance of Sentiment 181
30 Integrating Contrary Opinion and Technical Analysis 187
31 Why Interest Rates Affect the Stock Market 193
32 Using Technical Analysis to Select Individual Stocks 197
33 Technical Analysis of International Stock Markets 203
34 Automated Trading Systems 209
Index 214