- Gebundenes Buch
- Merkliste
- Auf die Merkliste
- Bewerten Bewerten
- Teilen
- Produkt teilen
- Produkterinnerung
- Produkterinnerung
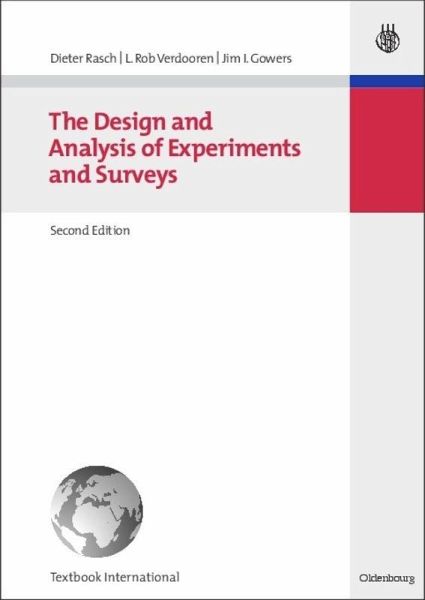
This volume is the English version of the second edition of the bilingual textbook by Rasch, Verdooren and Gowers (1999). A parallel version in German is available from the same publisher. This book is intended for students and experimental scientists in all disciplines and presumes only elementary statistical knowledge. This prerequisite knowledge is summarised briefly in appendix B. Knowledge of differential and integral calculus is not necessary for the understanding of the text. Matrix notation is explained in Appendix C. As well as the correction of errors, the present edition differs…mehr
Andere Kunden interessierten sich auch für
- Steven D. LevittSuperFreakonomics7,99 €
- Dan ArielyPredictably Irrational7,99 €
- Stephen J. DubnerWhen to Rob a Bank7,99 €
- Günter HettichMathematik für Wirtschaftswissenschaftler und Finanzmathematik29,95 €
- Anett Mehler-BicherMathematik für Wirtschaftswissenschaftler32,95 €
- Meik FriedrichMathematik und Statistik für Wirtschaftswissenschaftler34,95 €
- Otto OpitzMathematik-Übungsbuch19,95 €
-
-
-
This volume is the English version of the second edition of the bilingual textbook by Rasch, Verdooren and Gowers (1999). A parallel version in German is available from the same publisher. This book is intended for students and experimental scientists in all disciplines and presumes only elementary statistical knowledge. This prerequisite knowledge is summarised briefly in appendix B. Knowledge of differential and integral calculus is not necessary for the understanding of the text. Matrix notation is explained in Appendix C. As well as the correction of errors, the present edition differs from the first by the introduction of some new sections, such as that on testing the equality of two proportions (Section 3.4.4), and the inclusion of sequential tests. All new material is accompanied by descriptions of the relevant SPSS and CADEMO procedures.
Hinweis: Dieser Artikel kann nur an eine deutsche Lieferadresse ausgeliefert werden.
Produktdetails
- Produktdetails
- Textbook International
- Verlag: Oldenbourg
- 2nd ed.
- Seitenzahl: 272
- Erscheinungstermin: 7. Mai 2007
- Englisch
- Abmessung: 240mm x 170mm x 15mm
- Gewicht: 467g
- ISBN-13: 9783486582994
- ISBN-10: 3486582992
- Artikelnr.: 22627839
- Herstellerkennzeichnung Die Herstellerinformationen sind derzeit nicht verfügbar.
Prof. Dr. Dr. h.c. Dieter Rasch . Von 1991 bis zur Emeritierung Professor mit Lehrstuhl für mathematische Statistik an der Universität Wageningen. Studierte Mathematik und Mathematische Statistik (Promotion 1962, Habilitation 1965). War Gründer und von 1961-1990 Leiter der Abteilung Biometrie eines Forschungszentrums und von 1973-1990 Honorarprofessor für Wahrscheinlichkeitstheorie und Mathematische Statistik an der Universität Rostock. Seit 2006 Gastprofessor an der Universität für Bodenkultur Wien. Über 260 wissenschaftliche Publikationen und 55 Fachbücher. 1949-1953 Oberschule, Zella Mehlis, Abiturabschluß 1953-1955 Student at the University of Jena, Mathematics 1955-1958 Student at the University of Leipzig, Ma¬thematical Statistics 1958 Master thesis on Estimation of Heritabi¬lities 1958-1991 Member of the Research Centre of Animal Production Dummerstorf Rostock (FZT), Germany 1960-1991 Lectures in Statistics at the University of Rostock, Germany 1961-1991 Head of the department of Biometry of the Research Centre of Animal Production Dummerstorf Rostoc 1961 PhD at the Math. Nat. Fakultät of the Universi¬ty of Leip¬zig (Factor Analysis) 1965 Habilitation (Analysis of Growth Curves) at the University of Rostock 1966-1978 Honorary Assistent Professor for Mathema¬tical Statistics at the University of Halle 1978-1991 Honorary Professor for Probability Theory and Mathematical Statistics at the University of Rostock 1991-2000 Professor for Mathematical Statistics, Department of Mathematics, Agricultural University, Wageningen, The Netherlands 1993-2000 Head of the Section Mathematical Statis¬tics 1995-1998 Head of the Department of Mathematics since April 2000 Guest at the Department of Mathematics, Agricultural University, Wageningen, The Netherlands 2000-2004 Senior researcher, BioMath GmbH Rostock, Germany Apri- June 2000 Guest Professor at the University of Vienna, Inst. of Statistics June 2001 Honorary Doctor degree from the St. Izstvan University Budapest March-July 2003 Guest Professor at the Math. Inst. of the University of Klagenfurt Oct. 2004 - Jan. 2005 Guest Professor at the Math. Inst. of the University of Klagenfurt Since 1.9.2006 Professor at the Inst. für Statistik und EDV, Univ. Für Bodenkultur, Wien Special research topics: Mathematical Statistics, Biometry, Population Genetics and Breeding, Analysis of growth curves, Nonlinear Regression, Robustness, Experimental Design, Clinical Trials.
1;Contents;8
2;Preface;12
3;1 Introduction;13
4;2 Planning Experiments and Surveys and the Description of simple Designs;18
4.1;2.1 Basic Ideas;18
4.2;2.2 Introduction to the Principles of Planning Experiments;20
4.3;2.3 Multiple Measurements, the Principle of Replication;23
4.4;2.4 Using Strata or Blocks to Eliminate the Effects of Noise Factors;24
4.4.1;2.4.1 Basic principles;24
4.4.2;2.4.2 Principles of Blocking and Stratification;26
4.5;2.5 Randomisation;29
4.5.1;2.5.1 Randomisation in Surveys - Random Sampling;30
4.5.2;2.5.2 Randomisation in Experimental Designs - Random Allocation;34
4.6;2.6 Block Designs;35
4.6.1;2.6.1 Basic Concepts;35
4.6.2;2.6.2 Completely Balanced Incomplete Block Designs;38
4.7;2.7 Factorial Designs;40
5;3 Design and Analysis of Completely Randomised Designs;42
5.1;3.1 Point Estimation of Parameters.;44
5.1.1;3.1.1 Point Estimation of the Parameters of a Normal Distribution;48
5.1.2;3.1.2 Point Estimation of the Parameter;50
5.1.3;3.1.3 Point Estimation in Surveys;51
5.2;3.2 Interval Estimation;56
5.2.1;3.2.1 Confidence Intervals for the Parameters of a Distribution;56
5.2.2;3.2.2 Confidence Intervals for the Difference between the Means of Two Normal Distributions;71
5.3;3.3 Selection Procedures;77
5.4;3.4 Hypothesis Testing;82
5.4.1;3.4.1 Testing Hypotheses about the Mean of a Normal Distribution;86
5.4.2;3.4.2 Testing Hypotheses Concerning the Difference between the Means of Two Normal Distributions;90
5.4.3;3.4.3 Comparison of the Variances of Two Normal Distributions;98
5.4.4;3.4.4 Comparison between two Proportions using Independent Samples;101
5.4.5;3.4.5 Equivalence Tests;108
6;4 Analysis of Variance;110
6.1;4.1 One-way Analysis of Variance;110
6.1.1;4.1.1 One-way Analysis of Variance - Model I;111
6.1.2;4.1.2 One-way Analysis of Variance - Model II;117
6.2;4.2 Two-way Analysis of Variance;119
6.2.1;4.2.1 Two-way Analysis of Variance - Cross-classification;119
6.2.2;4.2.2 Two-way Analysis of Variance - Nested Classification;137
6.2.3;4.2.3 Notes on the Procedure for Higher Classifications;147
6.3;4.3 Multiple Comparisons of Means;148
6.3.1;4.3.1 Pairwise Comparisons between the Means of;150
6.3.2;4.3.2 Multiple Comparisons with a Standard Population;155
6.3.3;4.3.3 Overview of Minimal Sample Sizes;158
7;5 Regression Analysis;160
7.1;5.1 Scatter-plots;161
7.2;5.2 Model I and Model II in Regression Analysis;163
7.3;5.3 Parameter Estimation by the Method of Least Squares;166
7.4;5.4 Simple Linear Regression;171
7.4.1;5.4.1 Confidence Intervals;171
7.4.2;5.4.2 Optimal Designs in Model I;177
7.4.3;5.4.3 Hypothesis Testing;180
7.4.4;5.4.4 Special Problems in Model II;184
7.5;5.5 Multiple Linear Regression;187
7.5.1;5.5.1 Parameter Estimation;188
7.5.2;5.5.2 Confidence Intervals and Tests;193
7.5.3;5.5.3 Special Problems in Model II;194
7.5.4;5.5.4 Optimal Designs in Model I;197
7.6;5.6 Simple Polynomial Regression;197
7.7;5.7 Multiple Quadratic Regression;200
7.8;5.8 Intrinsically Non-linear Regression;208
8;6 Theoretical Assumptions and their Practical Importance the Robustness of Procedures;214
9;Appendix A Symbols;217
10;Appendix B Fundamentals in Statistics Overview;220
10.1;B.1 Descriptive Statistics;220
10.1.1;B.1.1 Population;220
10.1.2;B.1.2 Population Mean and Variance;220
10.1.3;B.1.3 Graphical Description;222
10.1.4;B.1.4 A Rule of Thumb;224
10.2;B.2 Frequencies and Probabilities;224
10.2.1;B.2.1 Introduction;224
10.2.2;B.2.2 Combining Frequencies and Probabilities;225
10.2.3;B.2.3 Probability Distributions;229
10.2.4;B.2.4 Expectation;238
10.2.5;B.2.5 Variance;240
10.2.6;B.2.6 Covariance;242
10.3;B.3 Sampling Distributions;244
10.3.1;B.3.1 Sample Mean;244
10.3.2;B.3.2 Sample variance;247
11;Appendix C Matrices;249
12;Tables;254
13;References;265
14;Subject Index;268