The Distribution of Australian Dragonflies
Versandkostenfrei!
Versandfertig in 1-2 Wochen
67,99 €
inkl. MwSt.

PAYBACK Punkte
34 °P sammeln!
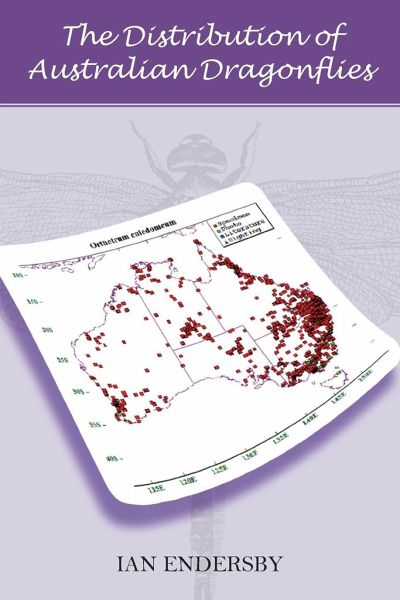
A guide to the distribution of Dragonflies in Australia: Distribution maps for 325 species of Australian Odonata derived from nearly 60,000 records Checklists and flight times for each of the 89 Interim Biogeographical Regions of Australia (IBRA7) Checklists and flight times for each of the 27 Köppen Climate Zones of Australia Upon reading in Tony Watson's paper on the distribution of Australia's dragonflies that Victoria (my home state) had only 63 species, I realised that it was a number I could get my mind around. Not like the beetles, moths or flies. Soon after, the chance finding of Fras...
A guide to the distribution of Dragonflies in Australia: Distribution maps for 325 species of Australian Odonata derived from nearly 60,000 records Checklists and flight times for each of the 89 Interim Biogeographical Regions of Australia (IBRA7) Checklists and flight times for each of the 27 Köppen Climate Zones of Australia Upon reading in Tony Watson's paper on the distribution of Australia's dragonflies that Victoria (my home state) had only 63 species, I realised that it was a number I could get my mind around. Not like the beetles, moths or flies. Soon after, the chance finding of Fraser's handbook of Australasian dragonflies in a secondhand book shop enabled me to extract a key to the Victorian species; thus was a new interest sparked. Having seen many of the local species, observed prolonged tandem underwater oviposition and the temperature-induced colour change of Austrolestes annulosus, I wondered if it would be possible to map the distribution of the Victorian species. So I visited the collection of the Melbourne Museum only to find that the label data had not yet been digitised. Years later, after re-gluing many dislodged heads and legs, I completed that task for the whole collection, which was Australia wide. With that as a start the project burgeoned to become mapping the distribution of all species recorded within Australia. With the invaluable help of curators and collection managers I was able to assemble all of the digitised records from Australian museums. Hobart required a special visit to digitise its collection label data. A preliminary set of maps was published in updated identification key prepared by Gunther Theischinger and myself. Since then I have continued to gather distribution data from overseas museums, additional records of Australian museums, species lists of visitors who can authenticate their identifications, from amongst the plethora of wildlife photographers those whose identifications I can trust, and where there are big gaps, from the odonatalogical literature. Encouraged by Vincent Kalkman to use the data to produce charts of flight times, it was obvious from the size and geographic spread of Australia, that any such charts would be latitude-, if not altitude-, dependent. The Interim Biogeographic Regionalisation for Australia (currently IBRA7) classifies Australia's landscapes into 89 large geographically distinct bioregions based on common climate, geology, landform, native vegetation and species information. It seemed an ideal vehicle to overcome this problem and so the distribution of each species was also sorted into IBRA7 categories before flight times were analysed. However, the characteristics which define biogeographic regions are probably not those which influence dragonfly distribution so a further analysis using climate zones was also made.


