279,99 €
inkl. MwSt.
Versandkostenfrei*
Versandfertig in über 4 Wochen
payback
140 °P sammeln
  • Gebundenes Buch

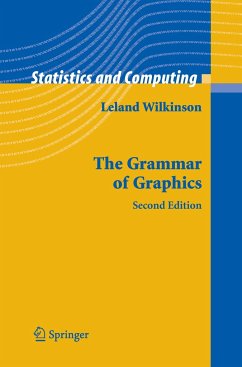
Preface to First Edition Before writing the graphics for SYSTAT in the 1980's, I began by teaching a seminar in statistical graphics and collecting as many different quantitative graphics as I could find. I was determined to produce a package that could draw every statistical graphic I had ever seen. The structure of the program was a collection of procedures named after the basic graph types they p- duced. The graphics code was roughly one and a half megabytes in size. In the early 1990's, I redesigned the SYSTAT graphics package using - ject-based technology. I intended to produce a more…mehr

Produktbeschreibung
Preface to First Edition Before writing the graphics for SYSTAT in the 1980's, I began by teaching a seminar in statistical graphics and collecting as many different quantitative graphics as I could find. I was determined to produce a package that could draw every statistical graphic I had ever seen. The structure of the program was a collection of procedures named after the basic graph types they p- duced. The graphics code was roughly one and a half megabytes in size. In the early 1990's, I redesigned the SYSTAT graphics package using - ject-based technology. I intended to produce a more comprehensive and - namic package. I accomplished this by embedding graphical elements in a tree structure. Rendering graphics was done by walking the tree and editing worked by adding and deleting nodes. The code size fell to under a megabyte. In the late 1990's, I collaborated with Dan Rope at the Bureau of Labor Statistics and Dan Carr at George Mason University to produce a graphics p- duction library called GPL, this time in Java. Our goal was to develop graphics components. This book was nourished by that project. So far, the GPL code size is under half a megabyte.
Hinweis: Dieser Artikel kann nur an eine deutsche Lieferadresse ausgeliefert werden.
Autorenporträt
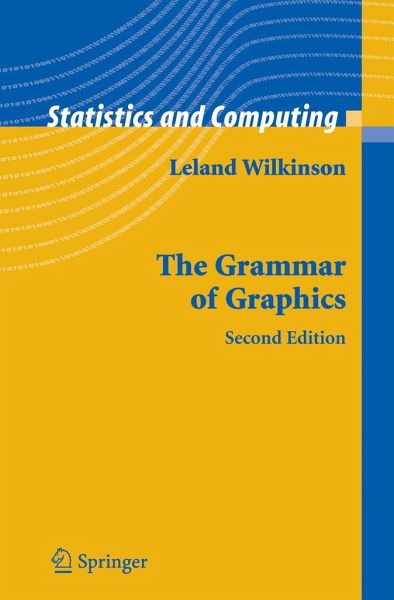
What are the rules that underlie the production of pie charts, bar charts, scatterplots, function plots, maps, mosaics, and radar charts? This book presents a unique foundation for producing almost every quantitative graphic found in scientific journals, newspapers, statistical packages, and data visualization systems. The second edition is almost twice the size of the original, with six new chapters and substantial revision.
Rezensionen
From the reviews of the second edition:

"This fascinating book deconstructs the process of producing graphics and in doing so raises many fascinating questions on the nature and representation of information...This second edition is almost twice the size of the original, with six new chapters and substantial revisions." Short Book Reviews of the International Statistical Institute, December 2005

"When the first edidtion of this book appeared in 2000 it was much praised. I called it a tour de force of the highest order. (Wainer, 2001), Edward Wegman (2000) argued that it was destined to become a classic. Now, six years later this very fine book has been much improved." Howard Wainer for Psychometrika

"...The second edition is an impressive expansion beyond a quite remarkable first edition. The text remains dense and even more encyclopedic, but it is a pleasure to read, whether a novice or an expert in graphics...this book is a bargain...The second edition is a must-have volume for anyone interested in graphics." Thomas E. Bradstreet for the Journal of the American Statistical Association, December 2006

"I find myself still thinking about the book and its ideas, several weeks after I finished reading it. I love that kind of book." Mark Bailey for Techometrics, Vol. 49, No. 1, February 2007

"Warts and all, The Grammar of Graphics is a richly rewarding work, an outstanding achievement by one of the leaders of statistical graphics. Seek it out." Nicholas J. Cox for the Journal of Statistical Software, January 2007

"The second edition is a quite fascinating book as well, and it comes with many color graphics. Anyone working in this field can see how many hours the author (plus coworkers) has spent on such a volume. ... Demands for good graphics are high and this book will help to wetten the appetite to create future computer packages that willmeet this demand. An occasional reader will get insights into a modern world of computing ... ." (Wolfgang Polasek, Statistical Papers, Vol. 48, 2007)

…mehr