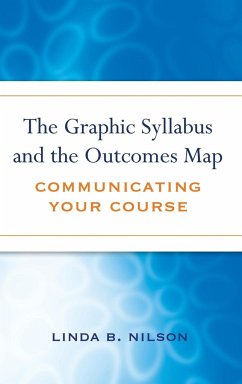
The Graphic Syllabus and the Outcomes Map An instructor's topical organization is the basic framework of his or her course as well as the core of the syllabus. A syllabus reflects the instructor's own unique organization of the field or specialty being taught, and his or her student learning objectives and outcomes provide the structure for student learning experiences and assessment activities. Yet students rarely read a text syllabus carefully. Even when they do, they lack the scholarly background to grasp the big picture of the course organization from the week-by-week topical listing and to understand the cumulative process by which they should acquire target knowledge and skills. This book shows college instructors how to communicate their course organization to students in a graphic syllabus--a one-page diagram, flowchart, or concept map of the topical organization--and an outcomes map--a one-page flowchart of the sequence of student learning objectives and outcomes from the foundational through the mediating to the ultimate. It also documents the positive impact that graphics have on student learning and cautions readers about common errors in designing graphic syllabi. In addition to more than two dozen graphic syllabi from a variety of disciplines, this book provides information on: * The limits of a text syllabus * How and why graphics enhance learning * Designing a graphic syllabus * Charting an outcomes map * How graphics benefit course organization
Hinweis: Dieser Artikel kann nur an eine deutsche Lieferadresse ausgeliefert werden.
Hinweis: Dieser Artikel kann nur an eine deutsche Lieferadresse ausgeliefert werden.


