- Broschiertes Buch
- Merkliste
- Auf die Merkliste
- Bewerten Bewerten
- Teilen
- Produkt teilen
- Produkterinnerung
- Produkterinnerung
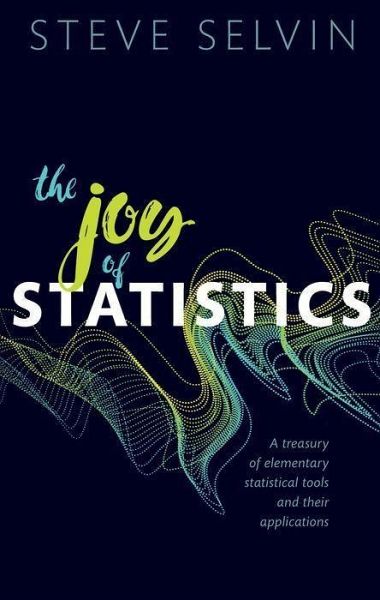
This book consists of 42 anecdotes illustrating how statistical methods applied to data produce insight and solutions to the questions that the data were collected to answer. Real-life and sometimes artificial data are used to demonstrate the painless method and magic of statistics. Statistical jokes, puzzles and folktales are scattered throughout.
Andere Kunden interessierten sich auch für
- Shizuhiko NishisatoAnalysis of Categorical Data50,99 €
- David McDowall (Distinguished Tea Distinguished Teaching ProfessorInterrupted Time Series Analysis39,99 €
- Andy FieldDiscovering Statistics Using R81,99 €
- Oliver LintonNumbers8,99 €
- Theoni PappasMath-A-Day: A Book of Days for Your Mathematical Year12,99 €
- Mary MortlockStudent Solutions Manual: For DeVore and Peck's Statistics the Exploration and Analysis of Data, Fifth Edition and Peck, Olsen, and DeVore's Int40,99 €
- Howard T TokunagaFundamental Statistics for the Social and Behavioral Sciences187,99 €
-
-
-
This book consists of 42 anecdotes illustrating how statistical methods applied to data produce insight and solutions to the questions that the data were collected to answer. Real-life and sometimes artificial data are used to demonstrate the painless method and magic of statistics. Statistical jokes, puzzles and folktales are scattered throughout.
Hinweis: Dieser Artikel kann nur an eine deutsche Lieferadresse ausgeliefert werden.
Produktdetails
- Produktdetails
- Verlag: Oxford University Press
- Seitenzahl: 240
- Erscheinungstermin: 22. Februar 2024
- Englisch
- Abmessung: 215mm x 137mm x 12mm
- Gewicht: 280g
- ISBN-13: 9780198896944
- ISBN-10: 0198896948
- Artikelnr.: 69521177
- Herstellerkennzeichnung
- Libri GmbH
- Europaallee 1
- 36244 Bad Hersfeld
- 06621 890
Steve Selvin is a professor of biostatistics and epidemiology at the University of California, Berkeley. He has taught on the Berkeley campus for more than 40 years. Professor Selvin is also a member of the Johns Hopkins School of Public Health faculty and has taught in the Summer Institute of Biostatistics and Epidemiology for the last fifteen years. He lives in the Berkeley hills with two cats, one dog and a wife who is a well known ceramic artist. He has authored or co-authored more than 250 scientific papers in the area of statistics applied to epidemiological/health issues with emphasis on birth defects and childhood cancer. In addition he has written 10 books on applied statistical methods. He has received a number of awards for teaching excellence, including the most prestigious award given by the University of California called the Berkeley Citation. His present research concerns the analysis of spatial patterns of childhood cancers in the state of California over the last decade.
* 1: Probabilities
rules and review * 2: Distributions of data
four plots * 3: Mean value
estimation and a few properties * 4: Boxplots
construction and interpretation * 5: The lady who tasted tea
a bit of statistical history * 6: Outlier/extreme values
a difficult decision * 7: The role of summary statistics
brief description * 8: Correlation and association
interpretation * 9: Proportional reduction in error
a measure of association * 10: Quick Tests
four examples * 11: Confounding
African
American and white infant mortality * 12: Odds
a sometimes measure of likelihood * 13: Odds ratio
a measure of risk? * 14: Odds ratio
two properties rarely mentioned * 15: Percent increase
ratios? * 16: Diagnostic tests
assessing accuracy * 17: Regression to the mean
father/son data * 18: Life table
a summary of mortality experience * 19: Coincidence
a statistical description * 20: Draft lottery numbers (1970) * 21: Lotto
How to get in .... How to win * 22: Fatal coronary disease
risk * 23: Pictures * 24: The Monty Hall problem * 25: Eye
witness evidence
Collins versus state of California * 26: Probabilities and puzzles * 27: Jokes and quotes * 28: A true life puzzle * 29: Rates
definition and estimation * 30: Geometry of an approximate average rate * 31: Simpson's paradox
two examples and a bit more * 32: Smoothing
median values * 33: Two by two table
a missing observation * 34: Survey data
randomized response * 35: Viral incidence estimation
a shortcut * 36: Two
way table
a graphical analysis * 37: Data
too good to be true? * 38: A binary variable
twin pairs * 39: Mr. Rich and Mr. Poor
a give and take equilibrium * 40: Log
normal distribution
leukemia and pesticide exposure * 41: Poem
A Contribution to Statistics * APP: appendix: golden mean, Pythagorean theorem, chord theorem, pi