27,99 €
inkl. MwSt.
Versandkostenfrei*
Versandfertig in 1-2 Wochen
payback
14 °P sammeln
  • Gebundenes Buch

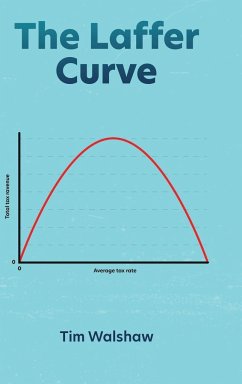
What is the maximum possible average tax rate before tax revenue begins to decline? This is described by the Laffer Curve. On a chart where the 'x' axis is the average tax rate and the 'y' axis is the total tax revenue, you can draw an upside down curve that has a peak at some point. Past that point, tax revenue declines. There is no dispute among economists about the correctness of this theory. The dispute among economists is whether the Laffer Curve exists in practice. This book estimates a mathematical formula for the Laffer Curve, and with that, estimates the maximum possible average tax…mehr

Produktbeschreibung
What is the maximum possible average tax rate before tax revenue begins to decline? This is described by the Laffer Curve. On a chart where the 'x' axis is the average tax rate and the 'y' axis is the total tax revenue, you can draw an upside down curve that has a peak at some point. Past that point, tax revenue declines. There is no dispute among economists about the correctness of this theory. The dispute among economists is whether the Laffer Curve exists in practice. This book estimates a mathematical formula for the Laffer Curve, and with that, estimates the maximum possible average tax rate for the USA at a certain date. This information is very useful for policy purposes.
Hinweis: Dieser Artikel kann nur an eine deutsche Lieferadresse ausgeliefert werden.
Autorenporträt
Tim Walshaw is a practicing economist who has written a number of useful books. In the past he worked as a research economics, and then moved successfully to consulting. He is now devoting his time writing books that would be very useful to non-economists.