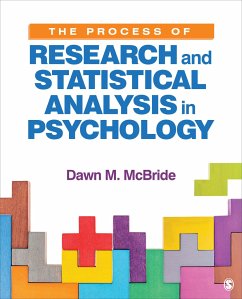
Dawn M. McBride
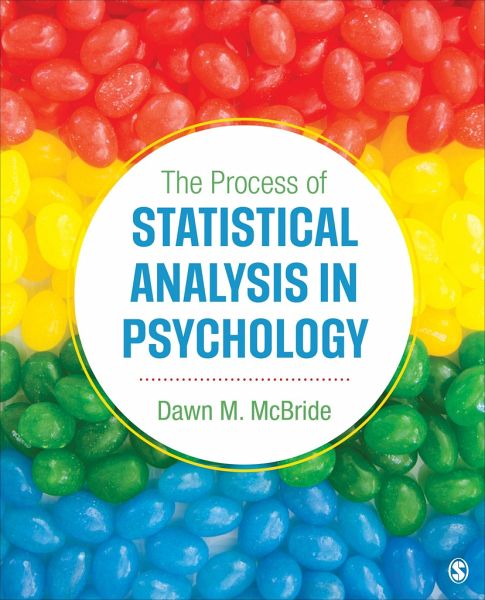
The Process of Statistical Analysis in Psychology
Dawn M. McBride
The Process of Statistical Analysis in Psychology
- Broschiertes Buch
- Merkliste
- Auf die Merkliste
- Bewerten Bewerten
- Teilen
- Produkt teilen
- Produkterinnerung
- Produkterinnerung
This new text provides students with the background and the process of statistical analysis along with the nuts and bolts tools for applying specific statistical tools to data from research studies.
Andere Kunden interessierten sich auch für
- Rick GurnseyStatistics for Research in Psychology233,99 €
- Dawn M. M. McBride (USA Illinois State University)The Process of Research in Psychology135,99 €
- Gregory J. Privitera (St. Bonaventure University)Research Methods for the Behavioral Sciences195,99 €
- Dawn M. McBrideLab Manual for Psychological Research66,99 €
- Brett W. PelhamConducting Research in Psychology168,99 €
- Donald F. Kettl (University of Texas, Austin, TX, USA)Politics of the Administrative Process186,99 €
- J. Micah Micah Roos (Virginia Polytechnic Institute and State UniveConfirmatory Factor Analysis49,99 €
-
-
-
This new text provides students with the background and the process of statistical analysis along with the nuts and bolts tools for applying specific statistical tools to data from research studies.
Hinweis: Dieser Artikel kann nur an eine deutsche Lieferadresse ausgeliefert werden.
Produktdetails
- Produktdetails
- Verlag: SAGE Publications Inc
- Seitenzahl: 392
- Erscheinungstermin: 4. Oktober 2017
- Englisch
- Abmessung: 239mm x 188mm x 20mm
- Gewicht: 638g
- ISBN-13: 9781506325224
- ISBN-10: 150632522X
- Artikelnr.: 48030417
- Herstellerkennzeichnung
- Libri GmbH
- Europaallee 1
- 36244 Bad Hersfeld
- 06621 890
Dawn M. McBride is professor of psychology at Illinois State University, where she has taught research methods since 1998. Her research interests include automatic forms of memory, false memory, prospective memory, task order choices, and forgetting. In addition to research methods, she teaches courses in introductory psychology, cognition and learning, and human memory; she also teaches a graduate course in experimental design. She is a recipient of the Illinois State University Teaching Initiative Award and the Illinois State University SPA/Psi Chi Jim Johnson Award for commitment to undergraduate mentorship, involvement, and achievement. Her nonacademic interests include spending time with her family, traveling, watching Philadelphia sports teams (it was a good year for Philly sports this year!), and reading British murder mysteries. She earned her PhD in cognitive psychology from the University of California, Irvine, and her BA from the University of California, Los Angeles.
Preface
About the Author
PART I: WHY DO WE USE STATISTICS?
1 Why Statistics?
What Can Statistics Do for Me?
Research Design and Statistics
Chapter Summary
Thinking About Research
Test Yourself
2 The Starting Place: Data and Distributions
Populations and Samples
Types of Data
Frequency Distributions
Frequency Distributions in Excel
Frequency Distributions in SPSS
Summary of Frequency Distributions
Chapter Summary
Thinking About Research
Test Yourself
3 Probability and Sampling
Concepts of Probability
Sampling Techniques
Distribution of Sample Means Introduction
Chapter Summary
Thinking About Research
Test Yourself
PART II: DESCRIPTIVE STATISTICS
4 Central Tendency
Central Tendency in Distributions
Mean
Median
Mode
Which Measure of Central Tendency Should I Use?
Chapter Summary
Thinking About Research
Test Yourself
5 Variability
Variability in Distributions
Range and Interquartile Range
Standard Deviation
Which Measure of Variability Should I Use?
Chapter Summary
Thinking About Research
Test Yourself
6 Presenting Descriptive Statistics
Descriptive Statistics in Graphs
Descriptive Statistics in Tables
APA Style for Graphs and Tables
Chapter Summary
Thinking About Research
Test Yourself
PART III: BASICS OF HYPOTHESIS TESTING
7 The Normal Distribution and z Scores
The z Score Transformation
The Normal Distribution
Chapter Summary
Thinking About Research
Test Yourself
8 Hypothesis-Testing Logic
Using the Normal Distribution to Test Hypotheses
Logic of Hypothesis Testing
Types of Hypothesis-Testing Errors
Statistical Significance
Chapter Summary
Thinking About Research
Test Yourself
PART IV: THE NUTS AND BOLTS OF STATISTICAL TESTS
9 The t Distribution
The t Distribution
One-Sample t Test
Using SPSS to Conduct a One-Sample t Test
Test Assumptions
Chapter Summary
Thinking About Research
Test Yourself
10 Related/Paired Samples t Test
Calculating a Related/Paired Samples t Test
Using SPSS to Conduct a Related/Paired Samples t Test
Test Assumptions
Chapter Summary
Thinking About Research
Test Yourself
11 Independent Samples t Test
Independent Samples
Calculating the Independent Samples t Test
Using SPSS to Conduct an Independent Samples t Test
Test Assumptions
Chapter Summary
Thinking About Research
Test Yourself
12 One-Way Analysis of Variance (ANOVA)
More Than Two Independent Samples
Calculating the F Score in an ANOVA
Using SPSS to Conduct a One-Way Between-Subjects ANOVA
Test Assumptions
Chapter Summary
Thinking About Research
Test Yourself
13 Two-Way Analysis of Variance (ANOVA)
Factorial Designs
Calculating a Two-Way ANOVA
Understanding Interactions
Using SPSS to Calculate Two-Way Between-Subjects ANOVAs
Test Assumptions
Chapter Summary
Thinking About Research
Test Yourself
14 One-Way Within-Subjects Analysis of Variance (ANOVA)
Within-Subjects Designs
Calculating a Within-Subjects ANOVA
Using SPSS to Calculate One-Way Within-Subjects ANOVAs
Test Assumptions
More Complex Within-Subjects Designs
Chapter Summary
Thinking About Research
Test Yourself
15 Correlation Tests and Simple Linear Regression
Correlation Versus Causation
Hypothesis Testing With Pearson r
Using SPSS to Conduct a Pearson r Test
Regression Analyses
Nonlinear Relationships
Chapter Summary
Thinking About Research
Test Yourself
16 Chi-Square Tests
Parametric Versus Nonparametric Tests
Observed Versus Expected Frequencies
Calculating a Chi-Square by Hand
Calculating a Chi-Square Using SPSS
Chapter Summary
Thinking About Research
Test Yourself
Appendix A: Answers to Stop and Think Questions
Appendix B: Unit Normal Table (z Table)
Appendix C: t Distribution Table
Appendix D: F Distribution Table
Appendix E: Pearson r Critical Values Table
Appendix F: Chi-Square Critical Values Table
Glossary
References
Index