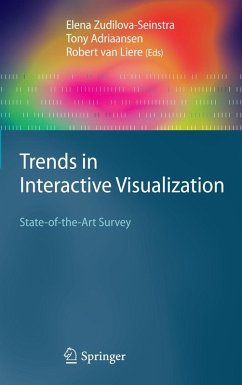
II Challenges in Data Mapping Part II deals with one of the most challenging tasks in Interactive Visualization, mapping and teasing out information from large complex datasets and generating visual representations. This section consists of four chapters. Binh Pham, Alex Streit, and Ross Brown provide a comprehensive requirement analysis of information uncertainty visualizations. They examine the sources of uncertainty, review aspects of its complexity, introduce typical models of uncertainty, and analyze major issues in visualization of uncertainty, from various user and task perspectives. Alfred Inselberg examines challenges in the multivariate data analysis. He explains how relations among multiple variables can be mapped uniquely into ?-space subsets having geometrical properties and introduces Parallel Coordinates meth- ology for the unambiguous visualization and exploration of a multidimensional geometry and multivariate relations. Christiaan Gribble describes two alternative approaches to interactive particle visualization: one targeting desktop systems equipped with programmable graphics hardware and the other targeting moderately sized multicore systems using pack- based ray tracing. Finally, Christof Rezk Salama reviews state-of-the-art strategies for the assignment of visual parameters in scientific visualization systems. He explains the process of mapping abstract data values into visual based on transfer functions, clarifies the terms of pre- and postclassification, and introduces the state-of-the-art user int- faces for the design of transfer functions.
From the reviews:
"This timely book intends, as the title suggests, to provide a state-of-the-art survey of the field of interactive visualization. A dozen chapters, contributed by various researchers, have been structured into four areas ... . Overall, the book is interesting and many of the chapters offer useful information for designing effective interactive visualization." (Xianjun Sam Zheng, ACM Computing Reviews, June, 2009)
"This timely book intends, as the title suggests, to provide a state-of-the-art survey of the field of interactive visualization. A dozen chapters, contributed by various researchers, have been structured into four areas ... . Overall, the book is interesting and many of the chapters offer useful information for designing effective interactive visualization." (Xianjun Sam Zheng, ACM Computing Reviews, June, 2009)


