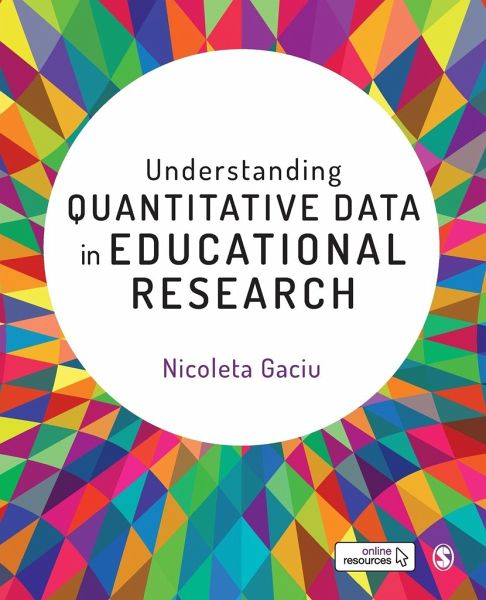
Nicoleta Gaciu
Understanding Quantitative Data in Educational Research
Nicoleta Gaciu
Understanding Quantitative Data in Educational Research
- Broschiertes Buch
- Merkliste
- Auf die Merkliste
- Bewerten Bewerten
- Teilen
- Produkt teilen
- Produkterinnerung
- Produkterinnerung
This book is designed to help Education students gain confidence in analysing and interpreting quantitative data and using appropriate statistical tests, by exploring, in plain language, a variety of data analysis methods.
Andere Kunden interessierten sich auch für
- Ann R. J. BriggsResearch Methods in Educational Leadership and Management41,99 €
- Zhiwei ChenResearch on Family Educational Influences on Chinese and German Learning Motivations47,90 €
- Susan LeydenSupporting the Child of Exceptional Ability at Home and School180,99 €
- Marlene C. CohenAddressing the Barriers Faced by Immigrant Students in Community Colleges56,99 €
- Dieter BerstecherA University of the Future83,99 €
- Barry HymerGifts, Talents and Education107,99 €
- Underachievement in Gifted Education179,99 €
-
-
-
This book is designed to help Education students gain confidence in analysing and interpreting quantitative data and using appropriate statistical tests, by exploring, in plain language, a variety of data analysis methods.
Produktdetails
- Produktdetails
- Verlag: Sage Publications
- Seitenzahl: 378
- Erscheinungstermin: 18. November 2020
- Englisch
- Abmessung: 235mm x 191mm x 21mm
- Gewicht: 686g
- ISBN-13: 9781473982154
- ISBN-10: 1473982154
- Artikelnr.: 59581871
- Herstellerkennzeichnung
- Books on Demand GmbH
- In de Tarpen 42
- 22848 Norderstedt
- info@bod.de
- 040 53433511
Dr Nicoleta Gaciu is Senior Lecturer in Education at Oxford Brookes University, UK. Her academic and research specialisations in disciplines such as physics, statistics, computer sciences, research methods and business have given her the best opportunities to make connections across disciplines, to view real-life phenomena through different lenses and to take different perspectives, knowledge, logical and methodological approaches for interdisciplinary research.
Part 1: Understanding quantitative data and R
1. Introduction to information, knowledge and quantitative data
2. An introduction to R and RStudio
Part 2: Data visualisation
3. Graphical representation of data
Part 3: Providing information about data
4. Descriptive statistics
5. Measures of dispersion and distributions
6. Normal distribution and standardised scores
Part 4: Making estimations and predictions from the data
7. Fundamentals of inferential statistics
8. Estimations and hypothesis testing
Part 5: From sample to population
9. One-sample tests
10. Differences between the independent or dependent two samples
11. Difference between more than two independent samples
12. Difference between more than two dependent samples
Part 6: Relationships and predictions
13. Relationship between variables
14. Predictions for independent and dependent variables