- Broschiertes Buch
- Merkliste
- Auf die Merkliste
- Bewerten Bewerten
- Teilen
- Produkt teilen
- Produkterinnerung
- Produkterinnerung
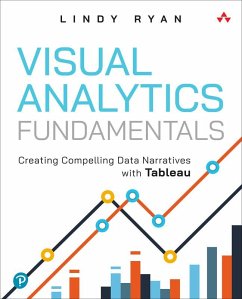
Master the fundamentals of modern visual analytics and craft compelling visual narratives in Tableau Do you need to persuade or inform people? Do you have data? Then you need to master visual analytics and visual storytelling. Today, the #1 tool for telling visual stories with data is Tableau, and demand for Tableau skills is soaring. In Visual ...
Andere Kunden interessierten sich auch für
![Expert Hadoop Administration Expert Hadoop Administration]() Sam AlapatiExpert Hadoop Administration51,99 €
Sam AlapatiExpert Hadoop Administration51,99 €![Machine Learning with Python for Everyone Machine Learning with Python for Everyone]() Mark FennerMachine Learning with Python for Everyone40,99 €
Mark FennerMachine Learning with Python for Everyone40,99 €![Making with Data Making with Data]() Making with Data60,99 €
Making with Data60,99 €![Learn Adobe Photoshop CC for Visual Communication Learn Adobe Photoshop CC for Visual Communication]() Rob SchwartzLearn Adobe Photoshop CC for Visual Communication49,99 €
Rob SchwartzLearn Adobe Photoshop CC for Visual Communication49,99 €![Prescriptive Analytics Prescriptive Analytics]() Dursun DelenPrescriptive Analytics49,99 €
Dursun DelenPrescriptive Analytics49,99 €![Product Analytics Product Analytics]() Joanne RodriguesProduct Analytics50,99 €
Joanne RodriguesProduct Analytics50,99 €![Big Data Fundamentals Big Data Fundamentals]() Thomas ErlBig Data Fundamentals40,99 €
Thomas ErlBig Data Fundamentals40,99 €-
-
-
Master the fundamentals of modern visual analytics and craft compelling visual narratives in Tableau Do you need to persuade or inform people? Do you have data? Then you need to master visual analytics and visual storytelling. Today, the #1 tool for telling visual stories with data is Tableau, and demand for Tableau skills is soaring. In Visual ...
Hinweis: Dieser Artikel kann nur an eine deutsche Lieferadresse ausgeliefert werden.
Hinweis: Dieser Artikel kann nur an eine deutsche Lieferadresse ausgeliefert werden.
Produktdetails
- Produktdetails
- Addison-Wesley Data & Analytics Series
- Verlag: Pearson Education (US)
- Seitenzahl: 288
- Erscheinungstermin: 25. Juni 2023
- Englisch
- Abmessung: 224mm x 185mm x 23mm
- Gewicht: 462g
- ISBN-13: 9780137956821
- ISBN-10: 0137956827
- Artikelnr.: 64780270
- Herstellerkennzeichnung
- Libri GmbH
- Europaallee 1
- 36244 Bad Hersfeld
- gpsr@libri.de
Lindy Ryan teaches visual analytics and data visualization in Rutgers' Professional Science Master's program. As Research Director for Radiant Advisors, she led work in data discovery, enablement, visualization, and visual analytics, and developed Radiant's Data Visualization Competency CenterTM methodology. Her books include The Visual Imperative and Visual Data Storytelling with Tableau (Addison-Wesley, 2018). A published novelist, screenwriter, and short-film director, her creative work has won numerous awards.
Preface xiv
Acknowledgments xxvi
About the Author xxvii
1. Welcome to Visual Analytics 1
A Visual Revolution 2
The Evolution from Data Visualization to Visual Data Storytelling 7
A Brief Look at the State of the Industry 9
From Visual to Story: Bridging the Gap 11
Summary 16
2. The Power of Visual Analytics 17
The Science of Storytelling 18
The Brain on Stories 19
The Human on Stories 21
The Power of Stories 23
The Classic Visualization Example 24
Using Small Personal Data for Big Stories 26
The Two-or-Four Season Debate 30
Napoleon's March 32
Stories Outside of the Box 34
Summary 35
3. Getting Started with Tableau 37
Using Tableau 38
Why Tableau? 39
The Tableau Product Portfolio 42
Tableau Desktop 43
Tableau Server 43
Tableau Cloud 44
Tableau Prep 44
Tableau Public 44
Tableau Reader and Tableau Viewer 44
Getting Started 45
Installing Tableau Desktop 46
Connecting to Data 46
Connecting to Table 48
Live Versus Extract 51
Connecting to Multiple Tables with Relationships and Joins 52
Adding and Replacing Data Sources 55
Basic Data Prep with Data Interpreter 57
Navigating the Tableau Interface 58
Menus and Toolbar 59
Data Pane 60
Shelves and Cards 60
Legends 60
Understanding Dimensions and Measures 61
Dimensions 61
Measures 61
Continuous and Discrete 61
Summary 62
4. Keeping Visual Analytics in Context 63
Context in Action 65
Harry Potter: Hero or Menace? 66
Ensuring Relevant Context 67
Exploratory Versus Explanatory Analysis 69
Structuring Visual Analytic Stories 73
Story Plot 74
Story Genre 75
Audience Analysis for Storytelling 76
Who 77
What 77
Why 77
How 78
Summary 80
5. Fundamental Data Visualizations 81
The Bar Chart 83
Tableau How-To: Bar Chart 84
The Line Chart 88
Tableau How-To: Line Chart 91
Pie and Doughnut Charts 91
Tableau How-To: Pie and Doughnut Charts 93
The Scatter Plot 98
Tableau How-To: Scatter Plots 98
The Packed Bubble Chart 102
Tableau How-To: Packed Bubble Charts 103
The Tree Map 105
Tableau How-To: Tree Maps 106
The Heat Map 108
Tableau How-To: Heat Maps 109
Summary 112
6. Fundamental Maps 113
Connecting to Geographic Data 116
Assigning Geographic Roles 117
Creating Geographic Hierarchies 120
Proportional Symbol Maps 123
Choropleth Map 127
7. Design Tips for Curating Visual Analytics 133
Visual Design Building Blocks 136
Color 138
Sequential Color 139
Diverging Color 140
Categorical Color 143
Color Effects 145
Opacity 146
Mark Borders 147
Mark Halos 147
Pre-attentive Colors 148
Important Color Considerations 150
The Truth About Red and Green 151
Lines 153
Formatting Grid Lines, Zero Lines, and Drop Lines 156
Formatting Borders 160
Formatting, Shading, and Banding 163
Shapes 168
Shape Marks Card 168
Custom Shapes 169
Summary 173
8. Structuring Analytics for Storytelling: Prep, Dashboards, and Stories
175
Basic Data Prep in Tableau: Data Interpreter 176
Data Interpreter in Action 177
Handling Nulls in Tableau 179
Pivoting Data from Wide to Tall 182
A Note on Preparing Survey Data for Visual Analysis 186
Storyboarding Your Visual Analytics 188
Understanding Stories in Tableau 189
The Storyboarding Process 198
Summary 200
9. Beyond Fundamentals: Advanced Visualizations 201
Timelines 202
Bar-in-Bar Charts 210
Likert-Scale Visualizations 213
A 100% Stacked Bar Chart 214
Divergent Stacked Bar Chart 216
Lollipop Charts 226
Labeled Lollipops 230
Word Clouds 231
Summary 234
10. Closing Thoughts 235
Five Steps to Visual Data Storytelling 236
Step 1. Find Data That Supports Your Story 236
Step 2. Layer Information for Understanding 237
Step 3. Design to Reveal 237
Step 4. Beware the False Reveal 238
Step 5. Tell It Fast 238
The Important Role of Feedback 238
Ongoing Learning 240
Teach Yourself: External Resources 240
Companion Materials to This Text 242
Appendix A. Tableau Services 243
Index 247


