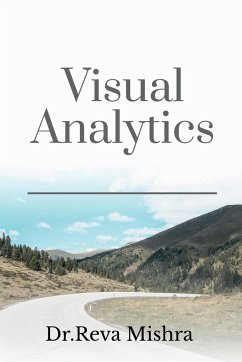
DATA VISUALIZATION FOR MBA STUDENTS Visual analytics is the use of sophisticated tools and processes to analyze datasets using visual representations of the data. Visualizing the data in graphs, charts, and maps helps users identify patterns and thereby develop actionable insights. These insights help organizations make better, data-driven decisions. vVisual Analytics Benefits Sometimes confused with data visualization, visual analytics isn't simply a matter of representing data graphically. Modern, interactive visual analytics makes it easy to combine data from multiple sources and deeply
Hinweis: Dieser Artikel kann nur an eine deutsche Lieferadresse ausgeliefert werden.
Hinweis: Dieser Artikel kann nur an eine deutsche Lieferadresse ausgeliefert werden.


