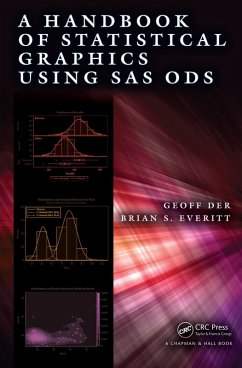
This handbook covers essential graphical methods for statisticians and explains how to implement the methods using SAS 9.4. It shows how to use SAS's newer ODS graphics to create many types of statistical graphics for exploring data and diagnosing fitted models. Each chapter deals graphically with several sets of example data from a wide variety of areas, such as epidemiology, medicine, and psychology. The SAS programs and data sets are available online.
Dieser Download kann aus rechtlichen Gründen nur mit Rechnungsadresse in A, B, BG, CY, CZ, D, DK, EW, E, FIN, F, GR, HR, H, IRL, I, LT, L, LR, M, NL, PL, P, R, S, SLO, SK ausgeliefert werden.

