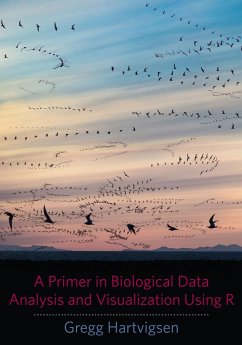
R is the most widely used open-source statistical and programming environment for the analysis and visualization of biological data. Drawing on Gregg Hartvigsen's extensive experience teaching biostatistics and modeling biological systems, this text is an engaging, practical, and lab-oriented introduction to R for students in the life sciences.
Underscoring the importance of R and RStudio in organizing, computing, and visualizing biological statistics and data, Hartvigsen guides readers through the processes of entering data into R, working with data in R, and using R to visualize data using histograms, boxplots, barplots, scatterplots, and other common graph types. He covers testing data for normality, defining and identifying outliers, and working with non-normal data. Students are introduced to common one- and two-sample tests as well as one- and two-way analysis of variance (ANOVA), correlation, and linear and nonlinear regression analyses. This volume also includes a section on advanced procedures and a chapter introducing algorithms and the art of programming using R.
Underscoring the importance of R and RStudio in organizing, computing, and visualizing biological statistics and data, Hartvigsen guides readers through the processes of entering data into R, working with data in R, and using R to visualize data using histograms, boxplots, barplots, scatterplots, and other common graph types. He covers testing data for normality, defining and identifying outliers, and working with non-normal data. Students are introduced to common one- and two-sample tests as well as one- and two-way analysis of variance (ANOVA), correlation, and linear and nonlinear regression analyses. This volume also includes a section on advanced procedures and a chapter introducing algorithms and the art of programming using R.
Dieser Download kann aus rechtlichen Gründen nur mit Rechnungsadresse in A, D ausgeliefert werden.

