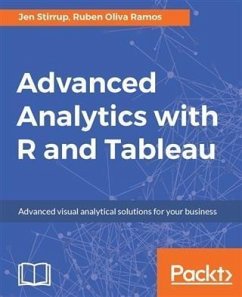
About This Book
- A comprehensive guide that will bring out the creativity in you to visualize the results of complex calculations using Tableau and R
- Combine Tableau analytics and visualization with the power of R using this step-by-step guide
- Wondering how R can be used with Tableau? This book is your one-stop solution.
This book will appeal to Tableau users who want to go beyond the Tableau interface and deploy the full potential of Tableau, by using R to perform advanced analytics with Tableau.
A basic familiarity with R is useful but not compulsory, as the book will start off with concrete examples of R and will move quickly into more advanced spheres of analytics using online data sources to support hands-on learning. Those R developers who want to integrate R in Tableau will also benefit from this book.
What You Will Learn
- Integrate Tableau's analytics with the industry-standard, statistical prowess of R.
- Make R function calls in Tableau, and visualize R functions with Tableau using RServe.
- Use the CRISP-DM methodology to create a roadmap for analytics investigations.
- Implement various supervised and unsupervised learning algorithms in R to return values to Tableau.
- Make quick, cogent, and data-driven decisions for your business using advanced analytical techniques such as forecasting, predictions, association rules, clustering, classification, and other advanced Tableau/R calculated field functions.
Tableau and R offer accessible analytics by allowing a combination of easy-to-use data visualization along with industry-standard, robust statistical computation.
Moving from data visualization into deeper, more advanced analytics? This book will intensify data skills for data viz-savvy users who want to move into analytics and data science in order to enhance their businesses by harnessing the analytical power of R and the stunning visualization capabilities of Tableau. Readers will come across a wide range of machine learning algorithms and learn how descriptive, prescriptive, predictive, and visually appealing analytical solutions can be designed with R and Tableau. In order to maximize learning, hands-on examples will ease the transition from being a data-savvy user to a data analyst using sound statistical tools to perform advanced analytics.
By the end of this book, you will get to grips with advanced calculations in R and Tableau for analytics and prediction with the help of use cases and hands-on examples.
Style and approach
Tableau (uniquely) offers excellent visualization combined with advanced analytics; R is at the pinnacle of statistical computational languages. When you want to move from one view of data to another, backed up by complex computations, the combination of R and Tableau makes the perfect solution. This example-rich guide will teach you how to combine these two to perform advanced analytics by integrating Tableau with R and create beautiful data visualizations.
Dieser Download kann aus rechtlichen Gründen nur mit Rechnungsadresse in A, B, BG, CY, CZ, D, DK, EW, E, FIN, F, GR, HR, H, IRL, I, LT, L, LR, M, NL, PL, P, R, S, SLO, SK ausgeliefert werden.
Hinweis: Dieser Artikel kann nur an eine deutsche Lieferadresse ausgeliefert werden.

