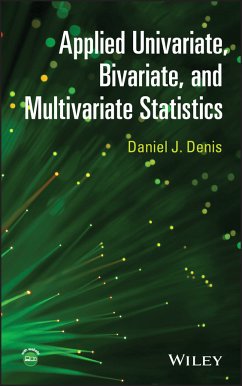
Applied Univariate, Bivariate, and Multivariate Statistics (eBook, PDF)


Alle Infos zum eBook verschenken

Applied Univariate, Bivariate, and Multivariate Statistics (eBook, PDF)
- Format: PDF
- Merkliste
- Auf die Merkliste
- Bewerten Bewerten
- Teilen
- Produkt teilen
- Produkterinnerung
- Produkterinnerung

Hier können Sie sich einloggen

Bitte loggen Sie sich zunächst in Ihr Kundenkonto ein oder registrieren Sie sich bei bücher.de, um das eBook-Abo tolino select nutzen zu können.
A clear and efficient balance between theory and application of statistical modeling techniques in the social and behavioral sciences Written as a general and accessible introduction, Applied Univariate, Bivariate, and Multivariate Statistics provides an overview of statistical modeling techniques used in fields in the social and behavioral sciences. Blending statistical theory and methodology, the book surveys both the technical and theoretical aspects of good data analysis. Featuring applied resources at various levels, the book includes statistical techniques such as t-tests and correlation…mehr
- Geräte: PC
- mit Kopierschutz
- eBook Hilfe
- Größe: 12.97MB
![Applied Univariate, Bivariate, and Multivariate Statistics (eBook, PDF) Applied Univariate, Bivariate, and Multivariate Statistics (eBook, PDF)]() Daniel J. DenisApplied Univariate, Bivariate, and Multivariate Statistics (eBook, PDF)111,99 €
Daniel J. DenisApplied Univariate, Bivariate, and Multivariate Statistics (eBook, PDF)111,99 €![Applied Univariate, Bivariate, and Multivariate Statistics Using Python (eBook, PDF) Applied Univariate, Bivariate, and Multivariate Statistics Using Python (eBook, PDF)]() Daniel J. DenisApplied Univariate, Bivariate, and Multivariate Statistics Using Python (eBook, PDF)107,99 €
Daniel J. DenisApplied Univariate, Bivariate, and Multivariate Statistics Using Python (eBook, PDF)107,99 €![Univariate, Bivariate, and Multivariate Statistics Using R (eBook, PDF) Univariate, Bivariate, and Multivariate Statistics Using R (eBook, PDF)]() Daniel J. DenisUnivariate, Bivariate, and Multivariate Statistics Using R (eBook, PDF)107,99 €
Daniel J. DenisUnivariate, Bivariate, and Multivariate Statistics Using R (eBook, PDF)107,99 €![SPSS Data Analysis for Univariate, Bivariate, and Multivariate Statistics (eBook, PDF) SPSS Data Analysis for Univariate, Bivariate, and Multivariate Statistics (eBook, PDF)]() Daniel J. DenisSPSS Data Analysis for Univariate, Bivariate, and Multivariate Statistics (eBook, PDF)96,99 €
Daniel J. DenisSPSS Data Analysis for Univariate, Bivariate, and Multivariate Statistics (eBook, PDF)96,99 €![Applied Univariate, Bivariate, and Multivariate Statistics (eBook, ePUB) Applied Univariate, Bivariate, and Multivariate Statistics (eBook, ePUB)]() Daniel J. DenisApplied Univariate, Bivariate, and Multivariate Statistics (eBook, ePUB)104,99 €
Daniel J. DenisApplied Univariate, Bivariate, and Multivariate Statistics (eBook, ePUB)104,99 €![Multivariate Analysis for the Biobehavioral and Social Sciences (eBook, PDF) Multivariate Analysis for the Biobehavioral and Social Sciences (eBook, PDF)]() Bruce L. BrownMultivariate Analysis for the Biobehavioral and Social Sciences (eBook, PDF)102,99 €
Bruce L. BrownMultivariate Analysis for the Biobehavioral and Social Sciences (eBook, PDF)102,99 €![Applied Univariate, Bivariate, and Multivariate Statistics Using Python (eBook, ePUB) Applied Univariate, Bivariate, and Multivariate Statistics Using Python (eBook, ePUB)]() Daniel J. DenisApplied Univariate, Bivariate, and Multivariate Statistics Using Python (eBook, ePUB)107,99 €
Daniel J. DenisApplied Univariate, Bivariate, and Multivariate Statistics Using Python (eBook, ePUB)107,99 €-
-
-
Dieser Download kann aus rechtlichen Gründen nur mit Rechnungsadresse in A, B, BG, CY, CZ, D, DK, EW, E, FIN, F, GR, HR, H, IRL, I, LT, L, LR, M, NL, PL, P, R, S, SLO, SK ausgeliefert werden.
- Produktdetails
- Verlag: John Wiley & Sons
- Seitenzahl: 768
- Erscheinungstermin: 2. November 2015
- Englisch
- ISBN-13: 9781118632314
- Artikelnr.: 44149890
- Verlag: John Wiley & Sons
- Seitenzahl: 768
- Erscheinungstermin: 2. November 2015
- Englisch
- ISBN-13: 9781118632314
- Artikelnr.: 44149890
- Herstellerkennzeichnung Die Herstellerinformationen sind derzeit nicht verfügbar.
1 1.1 The Philosophical Bases of Knowledge: Rationalistic versus Empiricist
Pursuits 1 1.2 What is a "Model"? 4 1.3 Social Sciences versus Hard
Sciences 6 1.4 Is Complexity a Good Depiction of Reality? Are Multivariate
Methods Useful? 8 1.5 Causality 9 1.6 The Nature of Mathematics:
Mathematics as a Representation of Concepts 10 1.7 As a Social Scientist
How Much Mathematics Do You Need to Know? 11 1.8 Statistics and Relativity
12 1.9 Experimental versus Statistical Control 13 1.10 Statistical versus
Physical Effects 14 1.11 Understanding What "Applied Statistics" Means 15
Review Exercises 15 2 Mathematics and Probability Theory 18 2.1 Set Theory
20 2.2 Cartesian Product A × B 24 2.3 Sets of Numbers 26 2.4 Set Theory
Into Practice: Samples Populations and Probability 27 2.5 Probability 28
2.6 Interpretations of Probability: Frequentist versus Subjective 35 2.7
Bayes' Theorem: Inverting Conditional Probabilities 39 2.8 Statistical
Inference 44 2.9 Essential Mathematics: Precalculus Calculus and Algebra 48
2.10 Chapter Summary and Highlights 72 Review Exercises 74 3 Introductory
Statistics 78 3.1 Densities and Distributions 79 3.2 Chi-Square
Distributions and Goodness-of-Fit Test 91 3.3 Sensitivity and Specificity
98 3.4 Scales of Measurement: Nominal Ordinal and Interval Ratio 98 3.5
Mathematical Variables versus Random Variables 101 3.6 Moments and
Expectations 103 3.7 Estimation and Estimators 106 3.8 Variance 108 3.9
Degrees of Freedom 110 3.10 Skewness and Kurtosis 111 3.11 Sampling
Distributions 113 3.12 Central Limit Theorem 116 3.13 Confidence Intervals
117 3.14 Bootstrap and Resampling Techniques 119 3.15 Likelihood Ratio
Tests and Penalized Log-Likelihood Statistics 121 3.16 Akaike's Information
Criteria 122 3.17 Covariance and Correlation 123 3.18 Other Correlation
Coefficients 128 3.19 Student's t Distribution 131 3.20 Statistical Power
139 3.21 Paired Samples t-Test: Statistical Test for Matched Pairs
(Elementary Blocking) Designs 146 3.22 Blocking with Several Conditions 149
3.23 Composite Variables: Linear Combinations 149 3.24 Models in Matrix
Form 151 3.25 Graphical Approaches 152 3.26 What Makes a p-Value Small? A
Critical Overview and Simple Demonstration of Null Hypothesis Significance
Testing 155 3.27 Chapter Summary and Highlights 164 Review Exercises 167 4
Analysis of Variance: Fixed Effects Models 173 4.1 What is Analysis of
Variance? Fixed versus Random Effects 174 4.2 How Analysis of Variance
Works: A Big Picture Overview 178 4.3 Logic and Theory of ANOVA: A Deeper
Look 180 4.4 From Sums of Squares to Unbiased Variance Estimators: Dividing
by Degrees of Freedom 189 4.5 Expected Mean Squares for One-Way Fixed
Effects Model: Deriving the F-Ratio 190 4.6 The Null Hypothesis in ANOVA
196 4.7 Fixed Effects ANOVA: Model Assumptions 198 4.8 A Word on
Experimental Design and Randomization 201 4.9 A Preview of the Concept of
Nesting 201 4.10 Balanced versus Unbalanced Data in ANOVA Models 202 4.11
Measures of Association and Effect Size in ANOVA: Measures of Variance
Explained 202 4.12 The F-Test and the Independent Samples t-Test 205 4.13
Contrasts and Post-Hocs 205 4.14 Post-Hoc Tests 212 4.15 Sample Size and
Power for ANOVA: Estimation with R and G*Power 218 4.16 Fixed Effects
One-Way Analysis of Variance in R: Mathematics Achievement as a Function of
Teacher 222 4.17 Analysis of Variance Via R's lm 226 4.18 Kruskal-Wallis
Test in R 227 4.19 ANOVA in SPSS: Achievement as a Function of Teacher 228
4.20 Chapter Summary and Highlights 230 Review Exercises 232 5 Factorial
Analysis of Variance: Modeling Interactions 237 5.1 What is Factorial
Analysis of Variance? 238 5.2 Theory of Factorial ANOVA: A Deeper Look 239
5.3 Comparing One-Way ANOVA to Two-Way ANOVA: Cell Effects in Factorial
ANOVA versus Sample Effects in One-Way ANOVA 245 5.4 Partitioning the Sums
of Squares for Factorial ANOVA: The Case of Two Factors 246 5.5
Interpreting Main Effects in the Presence of Interactions 253 5.6 Effect
Size Measures 253 5.7 Three-Way Four-Way and Higher-Order Models 254 5.8
Simple Main Effects 254 5.9 Nested Designs 256 5.9.1 Varieties of Nesting:
Nesting of Levels versus Subjects 257 5.10 Achievement as a Function of
Teacher and Textbook: Example of Factorial ANOVA in R 258 5.11 Interaction
Contrasts 266 5.12 Chapter Summary and Highlights 267 Review Exercises 268
6 Introduction to Random Effects and Mixed Models 270 6.1 What is Random
Effects Analysis of Variance? 271 6.2 Theory of Random Effects Models 272
6.3 Estimation in Random Effects Models 273 6.4 Defining Null Hypotheses in
Random Effects Models 276 6.5 Comparing Null Hypotheses in Fixed versus
Random Effects Models: The Importance of Assumptions 278 6.6 Estimating
Variance Components in Random Effects Models: ANOVA ML REML Estimators 279
6.7 Is Achievement a Function of Teacher? One-Way Random Effects Model in R
282 6.8 R Analysis Using REML 285 6.9 Analysis in SPSS: Obtaining Variance
Components 286 6.10 Factorial Random Effects: A Two-Way Model 287 6.11
Fixed Effects versus Random Effects: A Way of Conceptualizing Their
Differences 289 6.12 Conceptualizing the Two-Way Random Effects Model: The
Makeup of a Randomly Chosen Observation 289 6.13 Sums of Squares and
Expected Mean Squares for Random Effects: The Contaminating Influence of
Interaction Effects 291 6.14 You Get What You Go in with: The Importance of
Model Assumptions and Model Selection 293 6.15 Mixed Model Analysis of
Variance: Incorporating Fixed and Random Effects 294 6.16 Mixed Models in
Matrices 298 6.17 Multilevel Modeling as a Special Case of the Mixed Model:
Incorporating Nesting and Clustering 299 6.18 Chapter Summary and
Highlights 300 Review Exercises 301 7 Randomized Blocks and Repeated
Measures 303 7.1 What Is a Randomized Block Design? 304 7.2 Randomized
Block Designs: Subjects Nested Within Blocks 304 7.3 Theory of Randomized
Block Designs 306 7.4 Tukey Test for Nonadditivity 311 7.5 Assumptions for
the Variance-Covariance Matrix 311 7.6 Intraclass Correlation 313 7.7
Repeated Measures Models: A Special Case of Randomized Block Designs 314
7.8 Independent versus Paired Samples t-Test 315 7.9 The Subject Factor:
Fixed or Random Effect? 316 7.10 Model for One-Way Repeated Measures Design
317 7.11 Analysis Using R: One-Way Repeated Measures: Learning as a
Function of Trial 318 7.12 Analysis Using SPSS: One-Way Repeated Measures:
Learning as a Function of Trial 322 7.13 SPSS: Two-Way Repeated Measures
Analysis of Variance: Mixed Design: One Between Factor One Within Factor
326 7.14 Chapter Summary and Highlights 330 Review Exercises 331 8 Linear
Regression 333 8.1 Brief History of Regression 334 8.2 Regression Analysis
and Science: Experimental versus Correlational Distinctions 336 8.3 A
Motivating Example: Can Offspring Height Be Predicted? 337 8.4 Theory of
Regression Analysis: A Deeper Look 339 8.5 Multilevel Yearnings 342 8.6 The
Least-Squares Line 342 8.7 Making Predictions Without Regression 343 8.8
More About epsiloni 345 8.9 Model Assumptions for Linear Regression 346
8.10 Estimation of Model Parameters in Regression 349 8.11 Null Hypotheses
for Regression 351 8.12 Significance Tests and Confidence Intervals for
Model Parameters 353 8.13 Other Formulations of the Regression Model 355
8.14 The Regression Model in Matrices: Allowing for More Complex
Multivariable Models 356 8.15 Ordinary Least-Squares in Matrices 359 8.16
Analysis of Variance for Regression 360 8.17 Measures of Model Fit for
Regression: How Well Does the Linear Equation Fit? 363 8.18 Adjusted R2 364
8.19 What "Explained Variance" Means: And More Importantly What It Does Not
Mean 364 8.20 Values Fit by Regression 365 8.21 Least-Squares Regression in
R: Using Matrix Operations 365 8.22 Linear Regression Using R 368 8.23
Regression Diagnostics: A Check on Model Assumptions 370 8.24 Regression in
SPSS: Predicting Quantitative from Verbal 379 8.25 Power Analysis for
Linear Regression in R 383 8.26 Chapter Summary and Highlights 384 Review
Exercises 385 9 Multiple Linear Regression 389 9.1 Theory of Partial
Correlation and Multiple Regression 390 9.2 Semipartial Correlations 392
9.3 Multiple Regression 393 9.4 Some Perspective on Regression
Coefficients: "Experimental Coefficients"? 394 9.5 Multiple Regression
Model in Matrices 395 9.6 Estimation of Parameters 396 9.7 Conceptualizing
Multiple R 396 9.8 Interpreting Regression Coefficients: The Case of
Uncorrelated Predictors 397 9.9 Anderson's IRIS Data: Predicting Sepal
Length from Petal Length and Petal Width 397 9.10 Fitting Other Functional
Forms: A Brief Look at Polynomial Regression 402 9.11 Measures of
Collinearity in Regression: Variance Inflation Factor and Tolerance 403
9.12 R-Squared as a Function of Partial and Semipartial Correlations: The
Stepping Stones to Forward and Stepwise Regression 405 9.13 Model-Building
Strategies: Simultaneous Hierarchichal Forward and Stepwise 406 9.14 Power
Analysis for Multiple Regression 410 9.15 Introduction to Statistical
Mediation: Concepts and Controversy 411 9.16 Chapter Summary and Highlights
414 Review Exercises 415 10 Interactions in Multiple Linear Regression:
Dichotomous Polytomous and Continuous Moderators 418 10.1 The Additive
Regression Model with Two Predictors 420 10.2 Why the Interaction is the
Product Term xizi: Drawing an Analogy to Factorial ANOVA 420 10.3 A
Motivating Example of Interaction in Regression: Crossing a Continuous
Predictor with a Dichotomous Predictor 421 10.4 Theory of Interactions in
Regression 424 10.5 Simple Slopes for Continuous Moderators 427 10.6 A
Simple Numerical Example: How Slopes Can Change as a Function of the
Moderator 428 10.7 Calculating Simple Slopes: A Useful Algebraic Derivation
430 10.8 Summing Up the Idea of Interactions in Regression 432 10.9 Do
Moderators Really "Moderate" Anything? Some Philosophical Considerations
432 10.10 Interpreting Model Coefficients in the Context of Moderators 433
10.11 Mean-Centering Predictors: Improving the Interpretability of Simple
Slopes 434 10.12 The Issue of Multicollinearity: A Second Reason to Like
Mean-Centering 435 10.13 Interaction of Continuous and Polytomous
Predictors in R 436 10.14 Multilevel Regression: Another Special Case of
the Mixed Model 440 10.15 Chapter Summary and Highlights 441 Review
Exercises 441 11 Logistic Regression and the Generalized Linear Model 443
11.1 Nonlinear Models 445 11.2 Generalized Linear Models 447 11.3 Canonical
Links 450 11.4 Distributions and Generalized Linear Models 451 11.5
Dispersion Parameters and Deviance 453 11.6 Logistic Regression: A
Generalized Linear Model for Binary Responses 454 11.7 Exponential and
Logarithmic Functions 456 11.8 Odds Odds Ratio and the Logit 461 11.9
Putting It All Together: The Logistic Regression Model 462 11.10 Logistic
Regression in R: Challenger O-Ring Data 466 11.11 Challenger Analysis in
SPSS 469 11.12 Sample Size Effect Size and Power 473 11.13 Further
Directions 474 11.14 Chapter Summary and Highlights 475 Review Exercises
476 12 Multivariate Analysis of Variance 479 12.1 A Motivating Example:
Quantitative and Verbal Ability as a Variate 480 12.2 Constructing the
Composite 482 12.3 Theory of MANOVA 482 12.4 Is the Linear Combination
Meaningful? 483 12.5 Multivariate Hypotheses 487 12.6 Assumptions of MANOVA
488 12.7 Hotelling's T2: The Case of Generalizing from Univariate to
Multivariate 489 12.8 The Variance-Covariance Matrix S 492 12.9 From Sums
of Squares and Cross-Products to Variances and Covariances 494 12.10
Hypothesis and Error Matrices of MANOVA 495 12.11 Multivariate Test
Statistics 495 12.12 Equality of Variance-Covariance Matrices 500 12.13
Multivariate Contrasts 501 12.14 MANOVA in R and SPSS 502 12.15 MANOVA of
Fisher's Iris Data 508 12.16 Power Analysis and Sample Size for MANOVA 509
12.17 Multivariate Analysis of Covariance and Multivariate Models: A Bird's
Eye View of Linear Models 511 12.18 Chapter Summary and Highlights 512
Review Exercises 513 13 Discriminant Analysis 517 13.1 What is Discriminant
Analysis? The Big Picture on the Iris Data 518 13.2 Theory of Discriminant
Analysis 520 13.3 LDA in R and SPSS 523 13.4 Discriminant Analysis for
Several Populations 529 13.5 Discriminating Species of Iris: Discriminant
Analyses for Three Populations 532 13.6 A Note on Classification and Error
Rates 535 13.7 Discriminant Analysis and Beyond 537 13.8 Canonical
Correlation 538 13.9 Motivating Example for Canonical Correlation:
Hotelling's 1936 Data 539 13.10 Canonical Correlation as a General Linear
Model 540 13.11 Theory of Canonical Correlation 541 13.12 Canonical
Correlation of Hotelling's Data 544 13.13 Canonical Correlation on the Iris
Data: Extracting Canonical Correlation from Regression MANOVA LDA 546 13.14
Chapter Summary and Highlights 547 Review Exercises 548 14 Principal
Components Analysis 551 14.1 History of Principal Components Analysis 552
14.2 Hotelling 1933 555 14.3 Theory of Principal Components Analysis 556
14.4 Eigenvalues as Variance 557 14.5 Principal Components as Linear
Combinations 558 14.6 Extracting the First Component 558 14.7 Extracting
the Second Component 560 14.8 Extracting Third and Remaining Components 561
14.9 The Eigenvalue as the Variance of a Linear Combination Relative to Its
Length 561 14.10 Demonstrating Principal Components Analysis: Pearson's
1901 Illustration 562 14.11 Scree Plots 566 14.12 Principal Components
versus Least-Squares Regression Lines 569 14.13 Covariance versus
Correlation Matrices: Principal Components and Scaling 570 14.14 Principal
Components Analysis Using SPSS 570 14.15 Chapter Summary and Highlights 575
Review Exercises 576 15 Factor Analysis 579 15.1 History of Factor Analysis
580 15.2 Factor Analysis: At a Glance 580 15.3 Exploratory versus
Confirmatory Factor Analysis 581 15.4 Theory of Factor Analysis: The
Exploratory Factor-Analytic Model 582 15.5 The Common Factor-Analytic Model
583 15.6 Assumptions of the Factor-Analytic Model 585 15.7 Why Model
Assumptions Are Important 587 15.8 The Factor Model as an Implication for
the Covariance Matrix Sigma 587 15.9 Again Why is Sigma ^ LambdaLambda¿ ii
psi so Important a Result? 589 15.10 The Major Critique Against Factor
Analysis: Indeterminacy and the Nonuniqueness of Solutions 589 15.11 Has
Your Factor Analysis Been Successful? 591 15.12 Estimation of Parameters in
Exploratory Factor Analysis 592 15.13 Estimation of Factor Scores 593 15.14
Principal Factor 593 15.15 Maximum Likelihood 595 15.16 The Concepts (and
Criticisms) of Factor Rotation 596 15.17 Varimax and Quartimax Rotation 599
15.18 Should Factors Be Rotated? Is That Not "Cheating?" 600 15.19 Sample
Size for Factor Analysis 601 15.20 Principal Components Analysis versus
Factor Analysis: Two Key Differences 602 15.21 Principal Factor in SPSS:
Principal Axis Factoring 604 15.22 Bartlett Test of Sphericity and
Kaiser-Meyer-Olkin Measure of Sampling Adequacy (MSA) 612 15.23 Factor
Analysis in R: Holzinger and Swineford (1939) 613 15.24 Cluster Analysis
616 15.25 What Is Cluster Analysis? The Big Picture 617 15.26 Measuring
Proximity 619 15.27 Hierarchical Clustering Approaches 623 15.28
Nonhierarchical Clustering Approaches 625 15.29 K-Means Cluster Analysis in
R 626 15.30 Guidelines and Warnings About Cluster Analysis 630 15.31
Chapter Summary and Highlights 630 Review Exercises 632 16 Path Analysis
and Structural Equation Modeling 636 16.1 Path Analysis: A Motivating
Example--Predicting IQ Across Generations 637 16.2 Path Analysis and
"Causal Modeling" 639 16.3 Early Post-Wright Path Analysis: Predicting
Child's IQ (Burks 1928) 641 16.4 Decomposing Path Coefficients 642 16.5
Path Coefficients and Wright's Contribution 644 16.6 Path Analysis in R: A
Quick Overview--Modeling Galton's Data 644 16.7 Confirmatory Factor
Analysis: The Measurement Model 648 16.8 Structural Equation Models 650
16.9 Direct Indirect and Total Effects 652 16.10 Theory of Statistical
Modeling: A Deeper Look into Covariance Structures and General Modeling 653
16.11 Other Discrepancy Functions 655 16.12 The Discrepancy Function and
Chi-Square 656 16.13 Identification 657 16.14 Disturbance Variables 659
16.15 Measures and Indicators of Model Fit 660 16.16 Overall Measures of
Model Fit 660 16.17 Model Comparison Measures: Incremental Fit Indices 662
16.18 Which Indicator of Model Fit Is Best? 665 16.19 Structural Equation
Model in R 666 16.20 How All Variables Are Latent: A Suggestion for
Resolving the Manifest-Latent Distinction 668 16.21 The Structural Equation
Model as a General Model: Some Concluding Thoughts on Statistics and
Science 669 16.22 Chapter Summary and Highlights 670 Review Exercises 671
Appendix A: Matrix Algebra 675 References 705 Index 721
