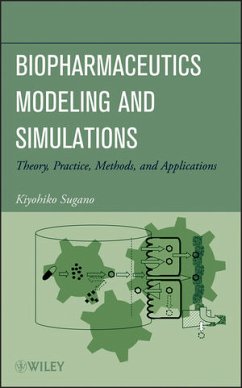
Biopharmaceutics Modeling and Simulations (eBook, PDF)
Theory, Practice, Methods, and Applications


Alle Infos zum eBook verschenken

Biopharmaceutics Modeling and Simulations (eBook, PDF)
Theory, Practice, Methods, and Applications
- Format: PDF
- Merkliste
- Auf die Merkliste
- Bewerten Bewerten
- Teilen
- Produkt teilen
- Produkterinnerung
- Produkterinnerung

Hier können Sie sich einloggen

Bitte loggen Sie sich zunächst in Ihr Kundenkonto ein oder registrieren Sie sich bei bücher.de, um das eBook-Abo tolino select nutzen zu können.
A comprehensive introduction to using modeling and simulation programs in drug discovery and development Biopharmaceutical modeling has become integral to the design and development of new drugs. Influencing key aspects of the development process, including drug substance design, formulation design, and toxicological exposure assessment, biopharmaceutical modeling is now seen as the linchpin to a drug's future success. And while there are a number of commercially available software programs for drug modeling, there has not been a single resource guiding pharmaceutical professionals to the…mehr
- Geräte: PC
- mit Kopierschutz
- eBook Hilfe
- Größe: 7.14MB
![Biopharmaceutics Modeling and Simulations (eBook, ePUB) Biopharmaceutics Modeling and Simulations (eBook, ePUB)]() Kiyohiko SuganoBiopharmaceutics Modeling and Simulations (eBook, ePUB)122,99 €
Kiyohiko SuganoBiopharmaceutics Modeling and Simulations (eBook, ePUB)122,99 €![Computational Pharmaceutics (eBook, PDF) Computational Pharmaceutics (eBook, PDF)]() Computational Pharmaceutics (eBook, PDF)114,99 €
Computational Pharmaceutics (eBook, PDF)114,99 €![Therapeutic Targets (eBook, PDF) Therapeutic Targets (eBook, PDF)]() Luis M. BotanaTherapeutic Targets (eBook, PDF)144,99 €
Luis M. BotanaTherapeutic Targets (eBook, PDF)144,99 €![Physiologically Based Pharmacokinetic (PBPK) Modeling and Simulations (eBook, PDF) Physiologically Based Pharmacokinetic (PBPK) Modeling and Simulations (eBook, PDF)]() Sheila Annie PetersPhysiologically Based Pharmacokinetic (PBPK) Modeling and Simulations (eBook, PDF)155,99 €
Sheila Annie PetersPhysiologically Based Pharmacokinetic (PBPK) Modeling and Simulations (eBook, PDF)155,99 €![Flavonoid Pharmacokinetics (eBook, PDF) Flavonoid Pharmacokinetics (eBook, PDF)]() Flavonoid Pharmacokinetics (eBook, PDF)111,99 €
Flavonoid Pharmacokinetics (eBook, PDF)111,99 €![Topical and Transdermal Drug Delivery (eBook, PDF) Topical and Transdermal Drug Delivery (eBook, PDF)]() Topical and Transdermal Drug Delivery (eBook, PDF)127,99 €
Topical and Transdermal Drug Delivery (eBook, PDF)127,99 €![Therapeutic Delivery Solutions (eBook, PDF) Therapeutic Delivery Solutions (eBook, PDF)]() Chung Chow ChanTherapeutic Delivery Solutions (eBook, PDF)113,99 €
Chung Chow ChanTherapeutic Delivery Solutions (eBook, PDF)113,99 €-
-
-
Dieser Download kann aus rechtlichen Gründen nur mit Rechnungsadresse in A, B, BG, CY, CZ, D, DK, EW, E, FIN, F, GR, HR, H, IRL, I, LT, L, LR, M, NL, PL, P, R, S, SLO, SK ausgeliefert werden.
- Produktdetails
- Verlag: John Wiley & Sons
- Seitenzahl: 528
- Erscheinungstermin: 19. Juli 2012
- Englisch
- ISBN-13: 9781118354315
- Artikelnr.: 37353153
- Verlag: John Wiley & Sons
- Seitenzahl: 528
- Erscheinungstermin: 19. Juli 2012
- Englisch
- ISBN-13: 9781118354315
- Artikelnr.: 37353153
- Herstellerkennzeichnung Die Herstellerinformationen sind derzeit nicht verfügbar.
LIST OF ABBREVIATIONS xxix
1 INTRODUCTION 1
1.1 An Illustrative Description of Oral Drug Absorption: The Whole Story 1
1.2 Three Regimes of Oral Drug Absorption 2
1.3 Physiology of the Stomach, Small Intestine, and Colon 5
1.4 Drug and API Form 6
1.4.1 Undissociable and Free Acid Drugs 6
1.4.2 Free Base Drugs 6
1.4.3 Salt Form Cases 6
1.5 The Concept of Mechanistic Modeling 7
References 8
2 THEORETICAL FRAMEWORK I: SOLUBILITY 10
2.1 Definition of Concentration 10
2.1.1 Total Concentration 11
2.1.2 Dissolved Drug Concentration 11
2.1.3 Effective Concentration 12
2.2 Acid-Base and Bile-Micelle-Binding Equilibriums 13
2.2.1 Monoprotic Acid and Base 14
2.2.2 Multivalent Cases 16
2.2.3 Bile-Micelle Partitioning 17
2.2.4 Modified Henderson-Hasselbalch Equation 18
2.2.5 Kbm from Log Poct 19
2.3 Equilibrium Solubility 19
2.3.1 Definition of Equilibrium Solubility 19
2.3.2 pH-Solubility Profile (pH-Controlled Region) 21
2.3.3 Solubility in a Biorelevant Media with Bile Micelles (pH-Controlled
Region) 23
2.3.4 Estimation of Unbound Fraction from the Solubilities with and without
Bile Micelles 25
2.3.5 Common Ionic Effect 25
2.3.6 Important Conclusion from the pH-Equilibrium Solubility Profile
Theory 27
2.3.7 Yalkowsky's General Solubility Equation 27
2.3.8 Solubility Increase by Converting to an Amorphous Form 29
2.3.9 Solubility Increase by Particle Size Reduction (Nanoparticles) 30
2.3.10 Cocrystal 31
References 31
3 THEORETICAL FRAMEWORK II: DISSOLUTION 33
3.1 Diffusion Coefficient 34
3.1.1 Monomer 34
3.1.2 Bile Micelles 35
3.1.3 Effective Diffusion Coefficient 36
3.2 Dissolution and Particle Growth 36
3.2.1 Mass Transfer Equations: Pharmaceutical Science Versus Fluid Dynamics
37
3.2.2 Dissolution Equation with a Lump Sum Dissolution Rate Coefficient
(kdiss) 38
3.2.3 Particle Size and Surface Area 39
3.2.3.1 Monodispersed Particles 39
3.2.3.2 Polydispersed Particles 41
3.2.4 Diffusion Layer Thickness I: Fluid Dynamic Model 41
3.2.4.1 Reynolds and Sherwood Numbers 42
3.2.4.2 Disk (Levich Equation) 45
3.2.4.3 Tube (Graetz Problem) 45
3.2.4.4 Particle Fixed to Space (Ranz-Marshall Equation) 46
3.2.4.5 Floating Particle 47
3.2.4.6 Nonspherical Particle 49
3.2.4.7 Minimum Agitation Speed for Complete Suspension 51
3.2.4.8 Other Factors 52
3.2.5 Diffusion Layer Thickness II: Empirical Models for Particles 52
3.2.6 Solid Surface pH and Solubility 53
3.3 Nucleation 56
3.3.1 General Description of Nucleation and Precipitation Process 56
3.3.2 Classical Nucleation Theory 57
3.3.2.1 Concept of Classical Nucleation Theory 58
3.3.2.2 Mathematical Expressions 58
3.3.3 Application of a Nucleation Theory for Biopharmaceutical Modeling 61
References 61
4 THEORETICAL FRAMEWORK III: BIOLOGICAL MEMBRANE PERMEATION 64
4.1 Overall Scheme 64
4.2 General Permeation Equation 66
4.3 Permeation Rate Constant, Permeation Clearance, and Permeability 66
4.4 Intestinal Tube Flatness and Permeation Parameters 68
4.5 Effective Concentration for Intestinal Membrane Permeability 70
4.5.1 Effective Concentration for Unstirred Water Layer Permeation 70
4.5.2 Effective Concentration for Epithelial Membrane Permeation: the Free
Fraction Theory 70
4.6 Surface Area Expansion by Plicate and Villi 71
4.7 Unstirred Water Layer Permeability 73
4.7.1 Basic Case 73
4.7.2 Particles in the UWL (Particle Drifting Effect) 74
4.8 Epithelial Membrane Permeability (Passive Processes) 76
4.8.1 Passive Transcellular Membrane Permeability: pH Partition Theory 76
4.8.2 Intrinsic Passive Transcellular Permeability 77
4.8.2.1 Solubility-Diffusion Model 77
4.8.2.2 Flip-Flop Model 79
4.8.2.3 Relationship between Ptrans,0 and log Poct 80
4.8.3 Paracellular Pathway 83
4.8.4 Relationship between log Doct, MW, and Fa% 84
4.9 Enteric Cell Model 84
4.9.1 Definition of Papp 86
4.9.2 Enzymatic Reaction: Michaelis-Menten Equation 87
4.9.3 First-Order Case 1: No Transporter and Metabolic Enzymes 88
4.9.4 First-Order Case 2: Efflux Transporter in Apical Membrane 91
4.9.5 Apical Efflux Transporter with Km and Vmax 95
4.9.6 Apical Influx Transporter with Km and Vmax 100
4.9.7 UWL and Transporter 100
4.9.7.1 No Transporter 101
4.9.7.2 Influx Transporter and UWL 101
4.9.7.3 Efflux Transporter 101
4.10 Gut Wall Metabolism 103
4.10.1 The Qgut Model 104
4.10.2 Simple Fg Models 104
4.10.3 Theoretical Consideration on Fg 104
4.10.3.1 Derivation of the Fg Models 105
4.10.3.2 Derivation of the Anatomical Fg Model 107
4.10.4 Interplay between CYP3A4 and P-gp 108
4.11 Hepatic Metabolism and Excretion 114
References 115
5 THEORETICAL FRAMEWORK IV: GASTROINTESTINAL TRANSIT MODELS AND INTEGRATION
122
5.1 GI Transit Models 122
5.1.1 One-Compartment Model/Plug Flow Model 122
5.1.2 Plug Flow Model 123
5.1.3 Three-Compartment Model 124
5.1.4 S1I7CX (X = 1-4) Compartment Models 124
5.1.5 Convection-Dispersion Model 126
5.1.6 Tapered Tube Model 126
5.2 Time-Dependent Changes of Physiological Parameters 127
5.2.1 Gastric Emptying 127
5.2.2 Water Mass Balance 128
5.2.3 Bile Concentration 129
5.3 Integration 1: Analytical Solutions 129
5.3.1 Dissolution Under Sink Condition 130
5.3.1.1 Monodispersed Particles 130
5.3.1.2 Polydispersed Particles 131
5.3.2 Fraction of a Dose Absorbed (Fa%) 132
5.3.3 Approximate Fa% Analytical Solutions 1: Case-by-Case Solution 133
5.3.3.1 Permeability-Limited Case 134
5.3.3.2 Solubility-Permeability-Limited Case 135
5.3.3.3 Dissolution-Rate-Limited Case 137
5.3.4 Approximate Fa% Analytical Solutions 2: Semi-General Equations 137
5.3.4.1 Sequential First-Order Kinetics of Dissolution and Permeation 137
5.3.4.2 Minimum Fa% Model 138
5.3.5 Approximate Fa% Analytical Solutions 3: FaSS Equation 139
5.3.5.1 Application Range 140
5.3.5.2 Derivation of Fa Number Equation 140
5.3.5.3 Refinement of the FaSS Equation 141
5.3.5.4 Advantage of FaSS Equation 146
5.3.5.5 Limitation of FaSS Equation 146
5.3.6 Interpretations of Fa Equations 146
5.3.7 Approximate Analytical Solution for Oral PK Model 147
5.4 Integration 2: Numerical Integration 147
5.4.1 Virtual Particle Bins 149
5.4.2 The Mass Balance of Dissolved Drug Amount in Each GI Position 149
5.4.3 Controlled Release of Virtual Particle Bin 150
5.5 In Vivo FA From PK Data 150
5.5.1 Absolute Bioavailability and Fa 151
5.5.2 Relative Bioavailability Between Solid and Solution Formulations 151
5.5.3 Relative Bioavailability Between Low and High Dose 152
5.5.4 Convolution and Deconvolution 152
5.5.4.1 Convolution 153
5.5.4.2 Deconvolution 154
5.6 Other Administration Routes 156
5.6.1 Skin 156
References 157
6 PHYSIOLOGY OF GASTROINTESTINAL TRACT AND OTHER ADMINISTRATION SITES IN
HUMANS AND ANIMALS 160
6.1 Morphology of Gastrointestinal Tract 160
6.1.1 Length and Tube Radius 160
6.1.2 Surface Area 161
6.1.2.1 Small Intestine 161
6.1.2.2 Colon 163
6.1.3 Degree of Flatness 164
6.1.3.1 Small Intestine 164
6.1.3.2 Colon 164
6.1.4 Epithelial Cells 165
6.1.4.1 Apical and Basolateral Lipid Bilayer Membranes 165
6.1.4.2 Tight Junction 168
6.1.4.3 Mucous Layer 168
6.2 Movement of the Gastrointestinal Tract 170
6.2.1 Transit Time 170
6.2.1.1 Gastric Emptying Time (GET) 170
6.2.1.2 Small Intestinal Transit Time 170
6.2.1.3 Colon Transit Time 171
6.2.2 Migrating Motor Complex 171
6.2.3 Agitation 173
6.2.3.1 Mixing Pattern 173
6.2.3.2 Agitation Strength 175
6.2.3.3 Unstirred Water Layer on the Intestinal Wall 176
6.3 Fluid Character of the Gastrointestinal Tract 178
6.3.1 Volume 178
6.3.1.1 Stomach 178
6.3.1.2 Small Intestine 178
6.3.1.3 Colon 179
6.3.2 Bulk Fluid pH and Buffer Concentration 179
6.3.2.1 Stomach 181
6.3.2.2 Small Intestine 181
6.3.2.3 Colon 181
6.3.3 Microclimate pH 181
6.3.3.1 Small Intestine 181
6.3.3.2 Colon 182
6.3.4 Bile Micelles 182
6.3.4.1 Stomach 183
6.3.4.2 Small Intestine 183
6.3.4.3 Colon 185
6.3.5 Enzymes and Bacteria 185
6.3.6 Viscosity, Osmolality, and Surface Tension 185
6.4 Transporters and Drug-Metabolizing Enzymes in the Intestine 186
6.4.1 Absorptive Drug Transporters 186
6.4.1.1 PEP-T1 186
6.4.1.2 OATP 186
6.4.2 Efflux Drug Transporters 186
6.4.2.1 P-gp 186
6.4.3 Drug-Metabolizing Enzymes 186
6.4.3.1 CYP3A4 186
6.4.3.2 Glucuronyl Transferase and Sulfotransferase 188
6.5 Intestinal and Liver Blood Flow 188
6.5.1 Absorption Sites Connected to Portal Vein 188
6.5.2 Villous Blood Flow (Qvilli) 188
6.5.3 Hepatic Blood Flow (Qh) 188
6.6 Physiology Related to Enterohepatic Recirculation 189
6.6.1 Bile Secretion 189
6.6.2 Mass Transfer into/from the Hepatocyte 190
6.6.2.1 Sinusoidal Membrane (Blood to Hepatocyte) 190
6.6.2.2 Canalicular Membrane (Hepatocyte to Bile Duct) 191
6.7 Nasal 191
6.8 Pulmonary 193
6.8.1 Fluid in the Lung 193
6.8.2 Mucociliary Clearance 193
6.8.3 Absorption into the Circulation 194
6.9 Skin 194
References 196
7 DRUG PARAMETERS 206
7.1 Dissociation Constant (pKa) 206
7.1.1 pH Titration 207
7.1.2 pH-UV Shift 207
7.1.3 Capillary Electrophoresis 207
7.1.4 pH-Solubility Profile 208
7.1.5 Calculation from Chemical Structure 208
7.1.6 Recommendation 208
7.2 Octanol-Water Partition Coefficient 208
7.2.1 Shake Flask Method 209
7.2.2 HPLC Method 210
7.2.3 Two-Phase Titration Method 210
7.2.4 PAMPA-Based Method 210
7.2.5 In Silico Method 210
7.2.6 Recommendation 210
7.3 Bile Micelle Partition Coefficient (Kbm) 211
7.3.1 Calculation from Solubility in Biorelevant Media 211
7.3.2 Spectroscopic Method 212
7.3.3 Recommendations 212
7.4 Particle Size and Shape 212
7.4.1 Microscope 213
7.4.2 Laser Diffraction 215
7.4.3 Dynamic Laser Scattering (DLS) 215
7.4.4 Recommendations 215
7.5 Solid Form 215
7.5.1 Nomenclature 215
7.5.1.1 Crystalline and Amorphous 215
7.5.1.2 Salts, Cocrystals, and Solvates 216
7.5.1.3 Hydrate 217
7.5.2 Crystal Polymorph 217
7.5.2.1 True Polymorph and Pseudopolymorph 217
7.5.2.2 Kinetic Resolution versus Stable Form 217
7.5.2.3 Dissolution Profile Advantages of Less Stable Forms 218
7.5.2.4 Enantiotropy 218
7.5.3 Solid Form Characterization 219
7.5.3.1 Polarized Light Microscopy (PLM) 219
7.5.3.2 Powder X-Ray Diffraction (PXRD) 219
7.5.3.3 Differential Scanning Calorimeter (DSC) and Thermal Gravity (TG)
220
7.5.3.4 High Throughput Solid Form Screening 221
7.5.4 Wettability and Surface Free Energy 222
7.5.5 True Density 222
7.6 Solubility 223
7.6.1 Terminology 223
7.6.1.1 Definition of Solubility 223
7.6.1.2 Intrinsic Solubility 223
7.6.1.3 Solubility in Media 223
7.6.1.4 Initial pH and Final pH 224
7.6.1.5 Supersaturable API 224
7.6.1.6 Critical Supersaturation Concentration and Induction Time 224
7.6.1.7 Dissolution Rate and Dissolution Profile 225
7.6.2 Media 225
7.6.2.1 Artificial Stomach Fluids 225
7.6.2.2 Artificial Small Intestinal Fluids 225
7.6.3 Solubility Measurement 225
7.6.3.1 Standard Shake Flask Method 225
7.6.3.2 Measurement from DMSO Sample Stock Solution 227
7.6.3.3 Solid Surface Solubility 228
7.6.3.4 Method for Nanoparticles 228
7.6.4 Recommendation 228
7.6.4.1 Early Drug Discovery Stage (HTS to Early Lead Optimization) 229
7.6.4.2 Late Lead Optimization Stage 229
7.6.4.3 Transition Stage between Discovery and Development 229
7.7 Dissolution Rate/Release Rate 230
7.7.1 Intrinsic Dissolution Rate 230
7.7.2 Paddle Method 230
7.7.2.1 Apparatus 231
7.7.2.2 Fluid Condition 231
7.7.2.3 Agitation 232
7.7.3 Flow-Through Method 233
7.7.4 Multicompartment Dissolution System 233
7.7.5 Dissolution Permeation System 233
7.7.6 Recommendation 235
7.8 Precipitation 235
7.8.1 Kinetic pH Titration Method 235
7.8.2 Serial Dilution Method 236
7.8.3 Two-Chamber Transfer System 236
7.8.4 Nonsink Dissolution Test 236
7.9 Epithelial Membrane Permeability 240
7.9.1 Back-Estimation from Fa% 241
7.9.2 In Situ Single-Pass Intestinal Perfusion 241
7.9.3 Cultured Cell Lines (Caco-2, MDCK, etc.) 243
7.9.4 PAMPA 244
7.9.5 Estimation of Ptrans,0 from Experimental Apparent Membrane
Permeability 246
7.9.6 Estimation of Ptrans,0 from Experimental log Poct 247
7.9.7 Mechanistic Investigation 247
7.9.8 Limitation of Membrane Permeation Assays 247
7.9.8.1 UWL Adjacent to the Membrane 249
7.9.8.2 Membrane Binding 250
7.9.8.3 Low Solubility 250
7.9.8.4 Differences in Paracellular Pathway 251
7.9.8.5 Laboratory to Laboratory Variation 251
7.9.8.6 Experimental Artifacts in Carrier-Mediated Membrane Transport 251
7.9.9 Recommendation for Pep and Peff Estimation 251
7.9.9.1 Hydrophilic Drugs 251
7.9.9.2 Lipophilic Drugs 252
7.9.9.3 Drugs with Medium Lipophilicity 252
7.10 In Vivo Experiments 252
7.10.1 P.O 252
7.10.2 I.V 253
7.10.3 Animal Species 253
7.10.4 Analysis 254
References 254
8 VALIDATION OF MECHANISTIC MODELS 266
8.1 Concerns Related to Model Validation Using In Vivo Data 267
8.2 Strategy for Transparent and Robust Validation of Biopharmaceutical
Modeling 267
8.3 Prediction Steps 268
8.4 Validation for Permeability-Limited Cases 279
8.4.1 Correlation Between Fa% and Peff Data for Humans (Epithelial Membrane
Permeability-Limited Cases PL-E) 279
8.4.2 Correlation Between In Vitro Permeability and Peff and/or Fa% (PL-E
Cases) 283
8.4.2.1 Caco-2 283
8.4.2.2 PAMPA 285
8.4.2.3 Experimental log Poct and pKa 285
8.4.3 Peff for UWL Limited Cases 287
8.4.4 Chemical Structure to Peff, Fa%, and Caco-2 Permeability 288
8.5 Validation for Dissolution-Rate and Solubility-Permeability-Limited
Cases (without the Stomach Effect) 290
8.5.1 Fa% Prediction Using In Vitro Dissolution Data 290
8.5.2 Fa% Prediction Using In Vitro Solubility and Permeability Data 292
8.6 Validation for Dissolution-Rate and Solubility-Permeability-Limited
Cases (with the Stomach Effect) 305
8.6.1 Difference Between Free Base and Salts 305
8.6.2 Simulation Model for Free Base 305
8.6.3 Simulation Results 307
8.7 Salts 307
8.8 Reliability of Biopharmaceutical Modeling 311
References 311
9 BIOEQUIVALENCE AND BIOPHARMACEUTICAL CLASSIFICATION SYSTEM 322
9.1 Bioequivalence 322
9.2 The History of BCS 324
9.3 Regulatory Biowaiver Scheme and BCS 326
9.3.1 Elucidation of BCS Criteria in Regulatory Biowaiver Scheme 327
9.3.1.1 Congruent Condition of Bioequivalence 328
9.3.1.2 Equivalence of Dose Number (Do) 329
9.3.1.3 Equivalence of Permeation Number (Pn) 329
9.3.1.4 Equivalence of Dissolution Number (Dn) 329
9.3.2 Possible Extension of the Biowaiver Scheme 331
9.3.2.1 Dose Number Criteria 331
9.3.2.2 Permeability Criteria 332
9.3.3 Another Interpretation of the Theory 332
9.3.3.1 Another Assumption about Dissolution Test 332
9.3.3.2 Assessment of Suitability of Dissolution Test Based on
Rate-Limiting Process 333
9.3.4 Validation of Biowaiver Scheme by Clinical BE Data 333
9.3.5 Summary for Regulatory BCS Biowaiver Scheme 334
9.4 Exploratory BCS 335
9.5 In Vitro-In Vivo Correlation 335
9.5.1 Levels of IVIVC 335
9.5.2 Judgment of Similarity Between Two Formulations (f2 Function) 336
9.5.3 Modeling the Relationship Between f2 and Bioequivalence 336
9.5.4 Point-to-Point IVIVC 337
References 338
10 DOSE AND PARTICLE SIZE DEPENDENCY 340
10.1 Definitions and Causes of Dose Nonproportionality 340
10.2 Estimation of the Dose and Particle Size Effects 341
10.2.1 Permeability-Limited Cases (PL) 341
10.2.2 Dissolution-Rate-Limited (DRL) Cases 341
10.2.3 Solubility-Epithelial Membrane Permeability Limited (SL-E) Cases 342
10.2.4 Solubility-UWL-Permeability-Limited Cases 344
10.3 Effect of Transporters 344
10.4 Analysis of In Vivo Data 345
References 346
11 ENABLING FORMULATIONS 347
11.1 Salts and Cocrystals: Supersaturating API 347
11.1.1 Scenarios of Oral Absorption of Salt 349
11.1.2 Examples 350
11.1.2.1 Example 1: Salt of Basic Drugs 350
11.1.2.2 Example 2: Salt of Acid Drugs 352
11.1.2.3 Example 3: Other Supersaturable API Forms 353
11.1.3 Suitable Drug for Salts 353
11.1.3.1 pKa Range 353
11.1.3.2 Supersaturability of Drugs 355
11.1.4 Biopharmaceutical Modeling of Supersaturable API Forms 357
11.2 Nanomilled API Particles 358
11.3 Self-Emulsifying Drug Delivery Systems (Micelle/Emulsion
Solubilization) 360
11.4 Solid Dispersion 363
11.5 Supersaturable Formulations 364
11.6 Prodrugs to Increase Solubility 365
11.7 Prodrugs to Increase Permeability 365
11.7.1 Increasing Passive Permeation 366
11.7.2 Hitchhiking the Carrier 366
11.8 Controlled Release 366
11.8.1 Fundamentals of CR Modeling 367
11.8.2 Simple Convolution Method 368
11.8.3 Advanced Controlled-Release Modeling 368
11.8.4 Controlled-Release Function 368
11.8.5 Sustained Release 368
11.8.5.1 Objectives to Develop a Sustained-Release Formulation 368
11.8.5.2 Suitable Drug Character for Sustained Release 369
11.8.5.3 Gastroretentive Formulation 369
11.8.6 Triggered Release 369
11.8.6.1 Time-Triggered Release 369
11.8.6.2 pH-Triggered Release 369
11.8.6.3 Position-Triggered Release 371
11.9 Communication with Therapeutic Project Team 371
References 373
12 FOOD EFFECT 379
12.1 Physiological Changes Caused by Food 379
12.1.1 Food Component 380
12.1.2 Fruit Juice Components 380
12.1.3 Alcohol 382
12.2 Types of Food Effects and Relevant Parameters in Biopharmaceutical
Modeling 382
12.2.1 Delay in Tmax and Decrease in Cmax 382
12.2.2 Positive Food Effect 383
12.2.2.1 Bile Micelle Solubilization 383
12.2.2.2 Increase in Hepatic Blood Flow 388
12.2.2.3 Increase in Intestinal Blood Flow 388
12.2.2.4 Inhibition of Efflux Transporter and Gut Wall Metabolism 389
12.2.2.5 Desaturation of Influx Transporter 391
12.2.3 Negative Food Effect 391
12.2.3.1 Bile Micelle Binding/Food Component Binding 391
12.2.3.2 Inhibition of Uptake Transporter 392
12.2.3.3 Desaturation of First-Pass Metabolism and Efflux Transport 394
12.2.3.4 Viscosity 398
12.2.3.5 pH Change in the Stomach 398
12.2.3.6 pH Change in the Small Intestine 398
12.3 Effect of Food Type 398
12.4 Biopharmaceutical Modeling of Food Effect 401
12.4.1 Simple Flowchart and Semiquantitative Prediction 401
12.4.2 More Complicated Cases 402
References 403
13 BIOPHARMACEUTICAL MODELING FOR MISCELLANEOUS CASES 412
13.1 Stomach pH Effect on Solubility and Dissolution Rate 412
13.1.1 Free Bases 413
13.1.2 Free Acids and Undissociable Drugs 413
13.1.3 Salts 413
13.1.4 Chemical and Enzymatic Degradation in the Stomach and Intestine 413
13.2 Intestinal First-Pass Metabolism 414
13.3 Transit Time Effect 415
13.3.1 Gastric Emptying Time 415
13.3.2 Intestinal Transit Time 415
13.4 Other Chemical and Physical Drug-Drug Interactions 415
13.4.1 Metal Ions 415
13.4.2 Cationic Resins 416
13.5 Species Difference 417
13.5.1 Permeability 417
13.5.2 Solubility/Dissolution 418
13.5.3 First-Pass Metabolism 419
13.6 Validation of GI Site-Specific Absorption Models 421
13.6.1 Stomach 421
13.6.2 Colon 422
13.6.3 Regional Difference in the Small Intestine: Fact or Myth? 422
13.6.3.1 Transporter 422
13.6.3.2 Bile-Micelle Binding and Bimodal Peak Phenomena 422
References 426
14 INTESTINAL TRANSPORTERS 430
14.1 Apical Influx Transporters 431
14.1.1 Case Example 1: Antibiotics 431
14.1.2 Case Example 2: Valacyclovir 433
14.1.3 Case Example: Gabapentin 434
14.2 Efflux Transporters 435
14.2.1 Effect of P-gp 435
14.2.2 Drug-Drug Interaction (DDI) via P-gp 437
14.3 Dual Substrates 438
14.3.1 Talinolol 438
14.3.2 Fexofenadine 441
14.4 Difficulties in Simulating Carrier-Mediated Transport 442
14.4.1 Absorptive Transporters 442
14.4.1.1 Discrepancies Between In Vitro and In Vivo Km Values 442
14.4.1.2 Contribution of Other Pathways 443
14.4.2 Efflux Transporters 443
14.5 Summary 445
References 446
15 STRATEGY IN DRUG DISCOVERY AND DEVELOPMENT 452
15.1 Library Design 452
15.2 Lead Optimization 453
15.3 Compound Selection 455
15.4 API Form Selection 455
15.5 Formulation Selection 455
15.6 Strategy to Predict Human Fa% 456
References 457
16 EPISTEMOLOGY OF BIOPHARMACEUTICAL MODELING AND GOOD SIMULATION PRACTICE
459
16.1 Can Simulation be so Perfect? 459
16.2 Parameter Fitting 460
16.3 Good Simulation Practice 461
16.3.1 Completeness 461
16.3.2 Comprehensiveness 462
References 463
APPENDIX A GENERAL TERMINOLOGY 464
A.1 Biopharmaceutic 464
A.2 Bioavailability (BA% or F) 464
A.3 Drug Disposition 465
A.4 Fraction of a Dose Absorbed (Fa) 465
A.5 Modeling/Simulation/In Silico 465
A.6 Active Pharmaceutical Ingredient (API) 465
A.7 Drug Product 465
A.8 Lipophilicity 465
A.9 Acid and Base 466
A.10 Solubility 466
A.11 Molecular Weight (MW) 466
A.12 Permeability of a Drug 466
APPENDIX B FLUID DYNAMICS 468
B.1 Navier-Stokes Equation and Reynolds Number 468
B.2 Boundary Layer Approximation 469
B.3 The Boundary Layer and Mass Transfer 470
B.4 The Thickness of the Boundary Layer 470
B.4.1 99% of Main Flow Speed 471
B.4.2 Displacement Thickness 471
B.4.3 Momentum Thickness 471
B.5 Sherwood Number 471
B.6 Turbulence 473
B.7 Formation of Eddies 474
B.8 Computational Fluid Dynamics 474
References 476
INDEX 477
