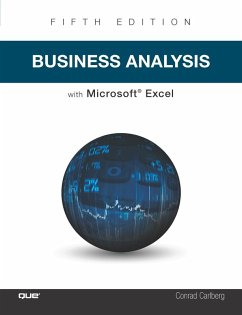
Business Analysis with Microsoft Excel (eBook, PDF)
Business Analysis with Microsoft Excel (eBook, PDF)
- Format: PDF
- Merkliste
- Auf die Merkliste
- Bewerten Bewerten
- Teilen
- Produkt teilen
- Produkterinnerung
- Produkterinnerung

Hier können Sie sich einloggen

Bitte loggen Sie sich zunächst in Ihr Kundenkonto ein oder registrieren Sie sich bei bücher.de, um das eBook-Abo tolino select nutzen zu können.
Gain Deeper Insights, Make Smarter Decisions, and Earn More Profits
It's time to put the full power of Excel quantitative analysis behind your management decisions!
Business analysis expert Conrad Carlberg shows you how to use Excel to perform core financial tasks all managers and entrepreneurs need to master: analyzing statements, planning and controlling company finances, making investment decisions, and managing sales and marketing. Carlberg helps you make the most of Excel's tools and features in everything from business case development to cash flow analysis.
Becoming an Excel…mehr
- Geräte: PC
- ohne Kopierschutz
- eBook Hilfe
- Größe: 14.22MB
![Regression Analysis Microsoft Excel (eBook, PDF) Regression Analysis Microsoft Excel (eBook, PDF)]() Carlberg ConradRegression Analysis Microsoft Excel (eBook, PDF)16,95 €
Carlberg ConradRegression Analysis Microsoft Excel (eBook, PDF)16,95 €![MOS 2016 Study Guide for Microsoft Excel (eBook, PDF) MOS 2016 Study Guide for Microsoft Excel (eBook, PDF)]() Joan LambertMOS 2016 Study Guide for Microsoft Excel (eBook, PDF)7,99 €
Joan LambertMOS 2016 Study Guide for Microsoft Excel (eBook, PDF)7,99 €![Excel 2016 VBA and Macros (eBook, PDF) Excel 2016 VBA and Macros (eBook, PDF)]() Bill JelenExcel 2016 VBA and Macros (eBook, PDF)16,95 €
Bill JelenExcel 2016 VBA and Macros (eBook, PDF)16,95 €![Microsoft Excel 2019 Data Analysis and Business Modeling (eBook, PDF) Microsoft Excel 2019 Data Analysis and Business Modeling (eBook, PDF)]() Winston WayneMicrosoft Excel 2019 Data Analysis and Business Modeling (eBook, PDF)28,95 €
Winston WayneMicrosoft Excel 2019 Data Analysis and Business Modeling (eBook, PDF)28,95 €![Microsoft Excel Inside Out (Office 2021 and Microsoft 365) (eBook, PDF) Microsoft Excel Inside Out (Office 2021 and Microsoft 365) (eBook, PDF)]() Bill JelenMicrosoft Excel Inside Out (Office 2021 and Microsoft 365) (eBook, PDF)26,95 €
Bill JelenMicrosoft Excel Inside Out (Office 2021 and Microsoft 365) (eBook, PDF)26,95 €![Microsoft Excel 2019 VBA and Macros (eBook, PDF) Microsoft Excel 2019 VBA and Macros (eBook, PDF)]() Jelen BillMicrosoft Excel 2019 VBA and Macros (eBook, PDF)20,95 €
Jelen BillMicrosoft Excel 2019 VBA and Macros (eBook, PDF)20,95 €![Exam Ref 70-778 Analyzing and Visualizing Data by Using Microsoft Power BI (eBook, PDF) Exam Ref 70-778 Analyzing and Visualizing Data by Using Microsoft Power BI (eBook, PDF)]() Daniil MaslyukExam Ref 70-778 Analyzing and Visualizing Data by Using Microsoft Power BI (eBook, PDF)21,95 €
Daniil MaslyukExam Ref 70-778 Analyzing and Visualizing Data by Using Microsoft Power BI (eBook, PDF)21,95 €-
-
-
It's time to put the full power of Excel quantitative analysis behind your management decisions!
Business analysis expert Conrad Carlberg shows you how to use Excel to perform core financial tasks all managers and entrepreneurs need to master: analyzing statements, planning and controlling company finances, making investment decisions, and managing sales and marketing. Carlberg helps you make the most of Excel's tools and features in everything from business case development to cash flow analysis.
Becoming an Excel expert has never been easier. You'll find crystal-clear instructions, real-world examples, insider insights, step-by-step projects, and much more. It's all complemented by extensive web-based resources, from sample journals and ledgers to business forecasting tools.
· Get more insight from income statements and balance sheets
· Manage current assets and value inventories
· Summarize transactions from journal to balance sheet
· Analyze working capital, cash flow, statements, and ratios
· Optimize budgeting and planning cycles
· Make more accurate and useful forecasts and projections
· Measure product or service quality
· Plan investments, set decision criteria, and perform sensitivity analyses
· Analyze profits, pricing, costs, contributions, and margins
· Make better decisions in uncertain conditions
· Understand and maximize the value of fixed assets
· Efficiently import and export business data
· Use Excel and Power BI to analyze data from QuickBooks or other sources
Dieser Download kann aus rechtlichen Gründen nur mit Rechnungsadresse in A, B, BG, CY, CZ, D, DK, EW, E, FIN, F, GR, HR, H, IRL, I, LT, L, LR, M, NL, PL, P, R, S, SLO, SK ausgeliefert werden.
- Produktdetails
- Verlag: Pearson ITP
- Seitenzahl: 528
- Altersempfehlung: ab 18 Jahre
- Erscheinungstermin: 17. Dezember 2018
- Englisch
- ISBN-13: 9780134862545
- Artikelnr.: 54820038
- Verlag: Pearson ITP
- Seitenzahl: 528
- Altersempfehlung: ab 18 Jahre
- Erscheinungstermin: 17. Dezember 2018
- Englisch
- ISBN-13: 9780134862545
- Artikelnr.: 54820038
Keeping Score
Choosing the Right Perspective
Defining Two Purposes for Accounting
Using the Income Statement
Choosing a Reporting Method
Cells in Excel
Measuring the Operating and Nonoperating Segments
Moving from the General Journal to the Income Statement
Getting the General Journal into Excel
Understanding Absolute, Relative, and Mixed References
Getting the Journal Data to the Ledger
Getting the Ledger Data to the Income Statement
Managing the Financial Analyses with Accrual Accounting
Using Straight-Line Depreciation
Preparing the Trial Balance
Moving Information into an Income Statement
Organizing with Traditional Versus Contribution Approaches
About Power BI
Power BI Desktop
Power BI Service and Mobile Apps
Summary
Chapter 2 Balance Sheet: Current Assets
Designing the Balance Sheet
Understanding Balance Sheet Accounts
Understanding Debit and Credit Entries
Getting a Current Asset Cash Balance
Using Sheet-Level Names
Getting a Cash Balance for Multiple Cash Accounts
Handling Restricted Cash Accounts
Getting a Current Asset Accounts Receivable Balance
Allowing for Doubtful Accounts
Using the Aging Approach to Estimating Uncollectibles
Using the Percentage of Sales Approach to Estimating Uncollectibles
Displaying Doubtful Account Balances with Power BI
Managing the Sort Order Via the Axis Values
Managing the Sort Order with Another Field
Getting a Prepaid Expenses Balance
Dealing with Insurance as a Prepaid Expense
Getting a Current Asset Balance
Understanding the Inventory Flow
Closing the Inventory Account
Closing the Revenue and Expense Accounts
Summary
Chapter 3 Valuing Inventories for the Balance Sheet
Understanding Perpetual and Periodic Inventory Systems
Perpetual Inventory Systems
Periodic Inventory Systems
Valuing Inventories
Valuation Methods Summarized
Using Specific Identification
Using Average Cost
Using the Moving Average Method
Using FIFO
Using LIFO
Comparing the Four Valuation Methods
Specification Identification
Average Cost
FIFO
LIFO
Handling Purchase Discounts
Calculating Turns Ratios
Summary
Chapter 4 Summarizing Transactions: From the Journals to the Balance Sheet
Understanding Journals
Understanding Special Journals
Structuring the Special Sales Journal
Structuring the Special Purchases Journal
Structuring the Cash Receipts Journal
Structuring the Cash Payments Journal
Excel Tables and Dynamic Range Names
Building Dynamic Range Names
Using Dynamic Range Names in the Journals
Choosing Between Tables and Dynamic Range Names
Understanding Ledgers
Creating the General Ledger
Using Subsidiary Ledgers
Automating the Posting Process
Getting a Current Liabilities Balance
Summary
Chapter 5 Working Capital and Cash Flow Analysis
Matching Costs and Revenues
Broadening the Definition: Cash Versus Working Capital
Determining the Amount of Working Capital
Determining Changes in Working Capital
Analyzing Cash Flow
Developing the Basic Information
Summarizing the Sources and Uses of Working Capital
Identifying Cash Flows Due to Operating Activities
Combining Cash from Operations with Cash from Nonoperating Transactions
Summary
Chapter 6 Statement Analysis
Understanding a Report by Means of Common-Sizing
Using Common-Sized Income Statements
Using Common-Sized Balance Sheets
Using Comparative Financial Statements
Using Dollar and Percent Changes in Statement Analysis
Assessing the Financial Statements
Handling Error Values
Evaluating Percentage Changes
Common-Sizing for Variance Analysis
Common-Sizing by Headcount
Showing Common-Sized Statements with Power BI
Summary
Chapter 7 Ratio Analysis
Interpreting Industry Averages and Trends
Comparing Ratios Within Industries
Analyzing Ratios Vertically and Horizontally
Getting a Basis for Ratios
Analyzing Profitability Ratios
Finding and Evaluating Earnings Per Share
Determining Gross Profit Margin
Determining Net Profit Margin
Determining the Return on Assets
Determining the Return on Equity
Analyzing Leverage Ratios
Determining the Debt Ratio
Determining the Equity Ratio
Determining the Times Interest Earned Ratio
Analyzing Liquidity Ratios
Determining the Current Ratio
Determining the Quick Ratio
Analyzing Activity Ratios
Determining the Average Collection Period
Determining Inventory Turnover
Displaying Financial Ratios in Power BI Reports
Summary
Chapter 8 Budgeting and Planning Cycle
Creating Pro Forma Financial Statements
Forecasting by Percentage of Sales
Using Excel to Manage the Analysis
Performing Sensitivity Analysis
Moving from the Pro Forma to the Budget
Projecting Quarterly Sales
Estimating Inventory Levels
Fitting the Budget to the Business Plan
Summary
Chapter 9 Forecasting and Projections
Making Sure You Have a Useful Baseline
Moving Average Forecasts
Creating Forecasts with the Moving Average Add-In
Dealing with the Layout of Excel’s Moving Averages
Creating Moving Average Forecasts with Excel’s Charts
Forecasting with Excel’s Regression Functions
Making Linear Forecasts: The TREND Function
Making Nonlinear Forecasts: The GROWTH Function
Creating Regression Forecasts with Excel’s Charts
Forecasting with Excel’s Smoothing Functions
Projecting with Smoothing
Using the Exponential Smoothing Tool
Choosing a Smoothing Constant
Making Smoothed Forecasts Handle Seasonal Data
Using the Box-Jenkins ARIMA Approach: When Excel’s Built-In Functions Won’t
Do
Understanding ARIMA Basics
Charting the Correlograms
Starting with Correlograms to Identify a Model
Identifying Other Box-Jenkins Models
Displaying Forecast Data with Power BI
Displaying Forecasts with Power BI
Using Power BI to Display Correlograms
Summary
Chapter 10 Measuring Quality
Monitoring Quality Through Statistical Process Control
Using Averages from Samples
Using X-and-S Charts for Variables
Interpreting the Control Limits
Manufacturing
Publishing Control Charts with Power BI
Using P-Charts for Dichotomies
Choosing the Sample Size
Determining That a Process Is Out of Control
Using X-and-MR Charts for Individual Observations
Creating SPC Charts Using Excel
Performing Acceptance Sampling
Charting the Operating Characteristic Curve
Using Worksheet Functions for Quality Control
Sampling Units from a Finite Population
Sampling Units from a Nonfinite Population
Using NORM.S.DIST to Approximate BINOM.DIST
Sampling Defects in Units
Using the BINOM.INV Function
Summary
Chapter 11 Examining a Business Case: Investment
Developing a Business Case
Getting Consensus for the Plan
Showing Your Work
Developing the Excel Model
Developing the Inputs
Identifying the Costs
Moving to the Pro Forma
Preparing the Cash Flow Analysis
Summary
Chapter 12 Examining Decision Criteria for a Business Case
Understanding Payback Periods
Understanding Future Value, Present Value, and Net Present Value
Calculating Future Value
Calculating Present Value
Calculating Net Present Value
Optimizing Costs
Summary
Chapter 13 Creating a Sensitivity Analysis for a Business Case
Reviewing the Business Case
Managing Scenarios
Saving a Scenario for the Base Case
Developing Alternative Scenarios
Developing Scenarios That Vary Expenses
Summarizing the Scenarios
Measuring Profit
Calculating Internal Rate of Return
Calculating Profitability Indexes
Estimating the Continuing Value
Varying the Discount Rate Input
Using the Goal Seek Tool
Summary
Chapter 14 Planning Profits
Understanding the Effects of Leverage
The Effect of Business Risk
Analyzing Operating Leverage
Evaluating the Financial Implications of an Operational Change
Evaluating Fixed Expenses
Evaluating Effect of Increasing Fixed Costs
Planning by Using the DOL
Analyzing Financial Leverage
Distinguishing Business from Financial Risk
Determining the Debt Ratio
Determining the Times Interest Earned Ratio
Summary
Chapter 15 Making Investment Decisions Under Uncertain Conditions
Using Standard Deviations
Using Excel’s Standard Deviation Functions
Understanding Confidence Intervals
Using Confidence Intervals in a Market Research Situation
Calculating a Confidence Interval
Interpreting the Interval
Refining Confidence Intervals
Using Regression Analysis in Decision Making
Regressing One Variable onto Another
Interpreting the Trendline
Avoiding Traps in Interpretation: Association Versus Causation
Regressing One Variable onto Several Other Variables: Multiple
Regression
Using Excel’s Regression Add-In
Interpreting Regression Output
Estimating with Multiple Regression
Using Excel’s TREND Function
Creating Charts in Power BI
Creating a Scatter Chart
Creating a Clustered Column Chart in Power BI
Summary
Chapter 16 Fixed Assets
Determining Original Cost
Determining Costs
Choosing Between Actual Cost and Replacement Cost
Depreciating Assets
Understanding the Concept of Depreciation
Matching Revenues to Costs
Using Straight-Line Depreciation
Using the Declining Balance Method
Using the Double Declining Balance Function to Calculate Depreciation
Using Variable Declining Balance Depreciation
Using Sum-of-Years’-Digits Depreciation
Summary
Chapter 17 Importing Business Data into Excel
Creating and Using ODBC Queries
Preparing to Import Data
Specifying Data Sources
Creating Queries with the Query Wizard
Creating Queries with Microsoft Query
Creating Parameterized Queries in Microsoft Query
Using Joins in Microsoft Query
Working with External Data Ranges
Include Row Numbers
Adjust Column Width
Preserve Column Sort/Filter/Layout
Preserve Cell Formatting
Insert Cells for New Data, Delete Unused Cells
Insert Entire Rows for New Data, Clear Unused Cells
Overwrite Existing Cells with New Data, Clear Unused Cells
Managing Security Information
Arranging Automatic Refreshes
Setting Other Data Range Options
Importing Data to Pivot Tables and Charts
Creating and Using Web Queries
Get External Data and Get Data From Web
Using Get Data with a Website
Using Get External Data and VBA
Summary
Chapter 18 Exporting Business Data from Excel
Using VBA to Update an External Database
Getting at VBA
Structuring the Worksheet
Establishing Command Buttons
Editing the Record’s Values
Using Database Objects
Using With Blocks
Finding the Right Record
Editing the Record
Adding New Records to the Recordset
Choosing to Use ADO
Summary
Chapter 19 Using Excel 2016 and Power BI to Analyze QuickBooks Data
Exporting an Income Statement to Excel
Publishing a QuickBooks Report in Power BI
Preparing the Data in Excel
Moving the Report to Power BI
Using the QuickBooks Software Development Kit
Parsing a Simple Subroutine
Invoking QBFC
Identifying the Sources of the Variables
Understanding then Rationale
Running the Assembly Tracker
Opening the QuickBooks Company File
Opening the Excel File
Allowing Access to QuickBooks Data
Chapter 20 Analyzing Contributions and Margins
Calculating the Contribution Margin
Classifying Costs
Estimating Semivariable Costs
Using Unit Contribution
Producing Digital Video Discs (Continued)
Increasing the Contribution Margin
Creating an Operating Income Statement
Finding the Break-Even Point
Calculating Breakeven in Units
Calculating Breakeven in Sales
Calculating Breakeven in Sales Dollars with a Specified Level of Profit
Charting the Break-Even Point
Choosing the Chart Type
Displaying a Break-Even Chart in Power BI
Making Assumptions in Contribution Analysis
Linear Relationships
Assignment of Costs
Constant Sales Mix
Worker Productivity
Determining Sales Mix
Summary
Chapter 21 Pricing and Costing
Using Absorption and Contribution Costing
Understanding Absorption Costing
Understanding Contribution Costing
Applying the Contribution Approach to a Pricing Decision: Goal Seek
Applying the Contribution Approach to a Pricing Decision: Solver
Using Contribution Analysis for New Products
Allocating Expenses to Product Lines
Varying the Inputs
Estimating the Effect of Cross-Elasticity
Summary
9780789759580 TOC 11/12/2018


