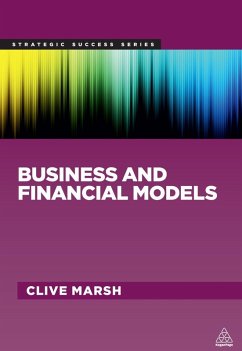
Clive Marsh
Business and Financial Models (eBook, ePUB)
24,95 €
24,95 €
inkl. MwSt.
Sofort per Download lieferbar

12 °P sammeln
24,95 €
Als Download kaufen

24,95 €
inkl. MwSt.
Sofort per Download lieferbar

12 °P sammeln
Jetzt verschenken
Alle Infos zum eBook verschenken
24,95 €
inkl. MwSt.
Sofort per Download lieferbar
Alle Infos zum eBook verschenken

12 °P sammeln
Clive Marsh
Business and Financial Models (eBook, ePUB)
- Format: ePub
- Merkliste
- Auf die Merkliste
- Bewerten Bewerten
- Teilen
- Produkt teilen
- Produkterinnerung
- Produkterinnerung

Bitte loggen Sie sich zunächst in Ihr Kundenkonto ein oder registrieren Sie sich bei
bücher.de, um das eBook-Abo tolino select nutzen zu können.
Hier können Sie sich einloggen
Hier können Sie sich einloggen
Sie sind bereits eingeloggt. Klicken Sie auf 2. tolino select Abo, um fortzufahren.

Bitte loggen Sie sich zunächst in Ihr Kundenkonto ein oder registrieren Sie sich bei bücher.de, um das eBook-Abo tolino select nutzen zu können.
A good business model should describe how an organization creates and delivers value, meaning that financial modelling is a vital tool for business strategy, allowing hypotheses and scenarios to be translated into numbers. It enables a company to experiment with different ideas and scenarios in a safe, low-risk environment, to consider what it is aiming to achieve, and to prioritize accordingly.
Business and Financial Models provides an accessible introduction to these essential strategic practices, with guidance on using Microsoft Excel for projection and analysis. The book takes you…mehr
- Geräte: eReader
- mit Kopierschutz
- eBook Hilfe
- Größe: 4.09MB
- FamilySharing(5)
Andere Kunden interessierten sich auch für
![Implications of post-crisis banking regulation after 2007 on the debt capital structures of German companies and corporate banking business models (eBook, ePUB) Implications of post-crisis banking regulation after 2007 on the debt capital structures of German companies and corporate banking business models (eBook, ePUB)]() Stephan MillerImplications of post-crisis banking regulation after 2007 on the debt capital structures of German companies and corporate banking business models (eBook, ePUB)36,99 €
Stephan MillerImplications of post-crisis banking regulation after 2007 on the debt capital structures of German companies and corporate banking business models (eBook, ePUB)36,99 €![The Contemporary CFO (eBook, ePUB) The Contemporary CFO (eBook, ePUB)]() Michael HauptThe Contemporary CFO (eBook, ePUB)27,95 €
Michael HauptThe Contemporary CFO (eBook, ePUB)27,95 €![Financial Accounting and Reporting for Non-Accounting Students (eBook, ePUB) Financial Accounting and Reporting for Non-Accounting Students (eBook, ePUB)]() Stephen M. FrostFinancial Accounting and Reporting for Non-Accounting Students (eBook, ePUB)30,95 €
Stephen M. FrostFinancial Accounting and Reporting for Non-Accounting Students (eBook, ePUB)30,95 €![Financial Management for Technology Start-Ups (eBook, ePUB) Financial Management for Technology Start-Ups (eBook, ePUB)]() Alnoor BhimaniFinancial Management for Technology Start-Ups (eBook, ePUB)24,95 €
Alnoor BhimaniFinancial Management for Technology Start-Ups (eBook, ePUB)24,95 €![Digital Finance (eBook, ePUB) Digital Finance (eBook, ePUB)]() Perry BeaumontDigital Finance (eBook, ePUB)47,95 €
Perry BeaumontDigital Finance (eBook, ePUB)47,95 €![The Routledge Handbook of Critical Finance Studies (eBook, ePUB) The Routledge Handbook of Critical Finance Studies (eBook, ePUB)]() The Routledge Handbook of Critical Finance Studies (eBook, ePUB)45,95 €
The Routledge Handbook of Critical Finance Studies (eBook, ePUB)45,95 €![Redefining Business Models (eBook, ePUB) Redefining Business Models (eBook, ePUB)]() Colin HaslamRedefining Business Models (eBook, ePUB)52,95 €
Colin HaslamRedefining Business Models (eBook, ePUB)52,95 €-
-
-
A good business model should describe how an organization creates and delivers value, meaning that financial modelling is a vital tool for business strategy, allowing hypotheses and scenarios to be translated into numbers. It enables a company to experiment with different ideas and scenarios in a safe, low-risk environment, to consider what it is aiming to achieve, and to prioritize accordingly.
Business and Financial Models provides an accessible introduction to these essential strategic practices, with guidance on using Microsoft Excel for projection and analysis. The book takes you through the process of building your model from the initial phase of formulating questions through modelling cash flow, budgets, investment appraisal and 'dashboard' tools for monitoring performance.
Ideal for both small and large companies, Business and Financial Models also includes coverage of new visual thinking techniques, like Structured Visual Thinking, and how these can be incorporated into conventional business modelling.
Online supporting resources for this book include downloadable figures from the book.
Hinweis: Dieser Artikel kann nur an eine deutsche Lieferadresse ausgeliefert werden.
Produktdetails
- Produktdetails
- Verlag: Kogan Page eBook
- Seitenzahl: 296
- Erscheinungstermin: 3. März 2013
- Englisch
- ISBN-13: 9780749468279
- Artikelnr.: 37827012
- Verlag: Kogan Page eBook
- Seitenzahl: 296
- Erscheinungstermin: 3. März 2013
- Englisch
- ISBN-13: 9780749468279
- Artikelnr.: 37827012
- Herstellerkennzeichnung Die Herstellerinformationen sind derzeit nicht verfügbar.
Clive Marsh has worked for Capgemini, Ernst & Young, IBM UK, Shell and several niche consultancies, and is a member of the Chartered Banker Institute's academic team. He has a Masters Degree in Strategic Financial Management, is a Chartered Banker and Fellow of the Chartered Banker Institute, an Associate Chartered Accountant of the New Zealand Institute of Chartered Accountants and a Fellow of the Chartered Management Institute. A regular contributor to financial and business journals, Clive is the author of a number of books, including Financial Management for Non-Financial Managers (also published by Kogan Page).
Introduction
1 Stages in the development of a business and financial model
Scope
The fundamental question
A step-by-step approach
Skills required
Planning the model
Data quality
Tools
Summary
2 Developing the research question and output definition
The basic question
Output definitions, examples, financial outputs
Summary
3 Visual thinking to develop fundamental questions - contributed by John
Caswell and Sarah Gall
Challenging the traditional business model
New methods and approaches -- a business model reflecting the world as it
is today
Structured Visual Thinking (a trade mark of Group Partners) principles for
a dynamic world
An architectural approach to building a future
4D (trade mark of Group Partners) approach
Summary
4 Input definition
Basics of input definition
Important variables
Summary
5 Scenario identification
Determining scenarios
Populating the spreadsheet with input values and formulae
Running different scenarios
Using Excel Scenario Manager for what-if analysis
Scenarios versus projections
Summary
6 Building a simple model
Process
Example
Data extraction using Excel pivot tables
Some reminders of best practice
Reasons for failure of a model and how to avoid them
Summary
7 Using charts
Excel charts
Example
Using charts to help concentrate on the most important variables in an
organization
Charts for break-even analysis
Chart tools
Presenting data and charts to communicate clearly
Using Excel pivot charts to show extracted data
Summary
8 Modelling budgets
Planning and budgeting
Departmental budgets and variance analysis
Some key departmental budgets
Capital budgets
Summary
9 Sales budgets
Sales budgets and forecasts are key to other budgets
Elements of a sales budget
Volume assumptions
Summary
10 Production - material, labour and direct overhead budgets
Production budget
Direct materials budget
Direct labour budget
Direct overhead budget
Gross margin and profit budget
Margin and profit sensitivity
Departmental budget spreadsheet
Summary
11 Fixed assets and depreciation
Accounting depreciation, straight line and reducing balance
Additions and disposals of assets
Tax depreciation (capital allowances in the UK)
Summary
12 Managing and modelling cash flow and working capital
The cash flow cycle
Working capital ratio
Optimal stock levels
Debtors
Cash models
Cash budget
Summary
13 Investment appraisal models
Relevant cash flow
Pay-back period
Return on capital
Accounting rate of return
Discounted cash flow and net present value/internal rate of return
Capital rationing
Summary
14 The cost of capital
The average and the marginal costs of capital
Balancing equity and external borrowing
Risk and the cost of capital
Methods of determining the cost of equity
Significance of the cost of capital
Summary
15 Business valuation models
The value of a business and building value
Methods of valuing a business
Who can value a business and what information do they require?
Examples of valuation methods and their appropriateness to valuation
reasons
Earnings-based valuations
Cash flow valuation models
Discounted cash flow (DCF) method of valuation
Summary
16 Performance indicators
Dashboards
Key performance indicators
The integrated standard costing system
Activity-based costing
Summary
17 Modelling the company balance sheet, P&L and ratio analysis
Prepare an Excel model
Analysis and financial ratios
Ratio analysis
Summary
18 Financial functions
Financial formulae and using Excel fx functions
Excel financial functions
Summary
19 Building a business model
Modelling a start-up business
Opening balance sheet
Expected returns for risk - proprietors pay, bank interest
Forecast profit and loss and sales requirement
Required marketing and selling activity
Direct costs required
Building a model
Key indicators
Business plan
Summary
20 Modelling projects
What is a project?
Critical path analysis (CPA)
CPA example
Risk and uncertainty
Gantt charts and resource planning
Modelling projects using Excel
Summary
21 Integration, complexity and business models
The level of integration required
Data and systems integration
Cloud computing
Summary
22 Business models for the green economy
Future challenges and opportunities
Production processes
Demand for greener products and services
Investor expectations
Resourcing
Effects of climate change and other factors
Supply chains
Social responsibility
Changing models
Modelling green issues
Summary
Appendix 1 Excel shortcut commands
Appendix 2 Chart for business model build project
Appendix 3 Discounted cash flow tables
