Haibin Xie, Kuikui Fan, Shouyang Wang
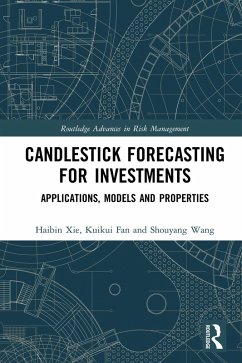
Candlestick Forecasting for Investments (eBook, ePUB)
Applications, Models and Properties
42,95 €
42,95 €
inkl. MwSt.
Sofort per Download lieferbar
21 °P sammeln
42,95 €
Als Download kaufen
42,95 €
inkl. MwSt.
Sofort per Download lieferbar
21 °P sammeln
Jetzt verschenken
Alle Infos zum eBook verschenken
42,95 €
inkl. MwSt.
Sofort per Download lieferbar
Alle Infos zum eBook verschenken
21 °P sammeln
Haibin Xie, Kuikui Fan, Shouyang Wang
Candlestick Forecasting for Investments (eBook, ePUB)
Applications, Models and Properties
- Format: ePub
- Merkliste
- Auf die Merkliste
- Bewerten Bewerten
- Teilen
- Produkt teilen
- Produkterinnerung
- Produkterinnerung
Bitte loggen Sie sich zunächst in Ihr Kundenkonto ein oder registrieren Sie sich bei
bücher.de, um das eBook-Abo tolino select nutzen zu können.
Hier können Sie sich einloggen
Sie sind bereits eingeloggt. Klicken Sie auf 2. tolino select Abo, um fortzufahren.
Bitte loggen Sie sich zunächst in Ihr Kundenkonto ein oder registrieren Sie sich bei bücher.de, um das eBook-Abo tolino select nutzen zu können.
Candlestick charts are often used in speculative markets to describe and forecast asset price movements. This book is the first of its kind to investigate candlestick charts and their statistical properties.
- Geräte: eReader
- ohne Kopierschutz
- eBook Hilfe
- Größe: 4.72MB
Andere Kunden interessierten sich auch für
- Brian O'LoughlinFundamentals of Investment (eBook, ePUB)50,95 €
- Yunjie WeiRenminbi Exchange Rate Forecasting (eBook, ePUB)39,95 €
- Smita Roy TrivediEffective Trading in Financial Markets Using Technical Analysis (eBook, ePUB)42,95 €
- Limits to Terrestrial Extraction (eBook, ePUB)21,95 €
- Keith McNultyHandbook of Graphs and Networks in People Analytics (eBook, ePUB)72,95 €
- David ListokinThe Fiscal Impact Handbook (eBook, ePUB)50,95 €
- Joyce ThompsenDiagnostics for Strategic Decision-Making (eBook, ePUB)61,95 €
-
-
-
Candlestick charts are often used in speculative markets to describe and forecast asset price movements. This book is the first of its kind to investigate candlestick charts and their statistical properties.
Dieser Download kann aus rechtlichen Gründen nur mit Rechnungsadresse in A, B, BG, CY, CZ, D, DK, EW, E, FIN, F, GR, HR, H, IRL, I, LT, L, LR, M, NL, PL, P, R, S, SLO, SK ausgeliefert werden.
Produktdetails
- Produktdetails
- Verlag: Taylor & Francis
- Seitenzahl: 132
- Erscheinungstermin: 11. März 2021
- Englisch
- ISBN-13: 9781000369403
- Artikelnr.: 60877165
- Verlag: Taylor & Francis
- Seitenzahl: 132
- Erscheinungstermin: 11. März 2021
- Englisch
- ISBN-13: 9781000369403
- Artikelnr.: 60877165
- Herstellerkennzeichnung Die Herstellerinformationen sind derzeit nicht verfügbar.
Haibin Xie is Associate Professor at the School of Banking and Finance, University of International Business and Economics.
Kuikui Fan is affiliated with the School of Statistics, Capital University of Economics and Business.
Shouyang Wang is Professor at the Academy of Mathematics and Systems Science, Chinese Academy of Sciences.
Kuikui Fan is affiliated with the School of Statistics, Capital University of Economics and Business.
Shouyang Wang is Professor at the Academy of Mathematics and Systems Science, Chinese Academy of Sciences.
PART I INTRODUCTION AND OUTLINE 1. Introduction 1.1 Technical analysis
before the 1970s 1.2 Technical analysis during 1990s-2000s 1.3 Recent
advances in technical analysis 1.4 Summary 2. Outline of this book PART II
CANDLESTICK 3. Basic concepts 4. Statistical properties 4.1 Propositions
4.2 Simulations 4.3 Empirical evidence 4.4 Summary PART III STATISTICAL
MODELS 5. DVAR model 5.1 The model 5.2 Statistical foundation 5.3
Simulations 5.4 Empirical results 5.5 Summary 6. Shadows in DVAR 6.1
Simulations 6.2 Theoretical explanation 6.3 Empirical evidence 6.4 Summary
PART IV APPLICATIONS 7. Market volatility timing 7.1 Introduction 7.2
GARCH@CARR model 7.3 Economic value of volatility timing 7.4 Empirical
results 7.5 Summary 8. Technical range forecasting 8.1 Introduction 8.2
Econometric methods 8.3 An empirical study 8.4 Summary 9. Technical range
spillover 9.1 Introduction 9.2 Econometric method 9.3 An empirical study:
DAX and CAC40 9.4 Summary 10. Stock return forecasting: U.S. S&P500 10.1
Introduction 10.2 Econometric methods 10.3 Statistical evidence 10.4
Economic evidence 10.5 More details 10.6 Summary 11. Oil price forecasting:
WTI Crude Oil 11.1 Introduction 11.2 Econometric method 11.3 Empirical
results 11.4 Summary PART V CONCLUSIONS AND FUTURE STUDIES 12. Main
conclusions 13. Future studies