25,95 €
25,95 €
inkl. MwSt.
Sofort per Download lieferbar
payback
13 °P sammeln
25,95 €
25,95 €
inkl. MwSt.
Sofort per Download lieferbar

Alle Infos zum eBook verschenken
payback
13 °P sammeln
Als Download kaufen
25,95 €
inkl. MwSt.
Sofort per Download lieferbar
payback
13 °P sammeln
Jetzt verschenken
25,95 €
inkl. MwSt.
Sofort per Download lieferbar

Alle Infos zum eBook verschenken
payback
13 °P sammeln
  • Format: PDF

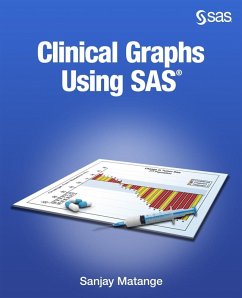
SAS users in the Health and Life Sciences industry need to create complex graphs to analyze biostatistics data and clinical data, and they need to submit drugs for approval to the FDA. Graphs used in the HLS industry are complex in nature and require innovative usage of the graphics features. Clinical Graphs Using SAS® provides the knowledge, the code, and real-world examples that enable you to create common clinical graphs using SAS graphics tools, such as the Statistical Graphics procedures and the Graph Template Language. This book describes detailed processes to create many commonly used…mehr

Produktbeschreibung
SAS users in the Health and Life Sciences industry need to create complex graphs to analyze biostatistics data and clinical data, and they need to submit drugs for approval to the FDA. Graphs used in the HLS industry are complex in nature and require innovative usage of the graphics features. Clinical Graphs Using SAS® provides the knowledge, the code, and real-world examples that enable you to create common clinical graphs using SAS graphics tools, such as the Statistical Graphics procedures and the Graph Template Language. This book describes detailed processes to create many commonly used graphs in the Health and Life Sciences industry. For SAS® 9.3 and SAS® 9.4 it covers many improvements in the graphics features that are supported by the Statistical Graphics procedures and the Graph Template Language, many of which are a direct result of the needs of the Health and Life Sciences community. With the addition of new features in SAS® 9.4, these graphs become positively easy to create. Topics covered include the usage of SGPLOT procedure, the SGPANEL procedure and the Graph Template Language for the creation of graphs like forest plots, swimmer plots, and survival plots.

Dieser Download kann aus rechtlichen Gründen nur mit Rechnungsadresse in A, D ausgeliefert werden.

Autorenporträt
Sanjay Matange is an R & D Director in the Data Visualization Division at SAS, responsible for the development and support of ODS Graphics. This includes the Graph Template Language (GTL), Statistical Graphics (SG) procedures, ODS Graphics Designer, and other related graphics applications. Sanjay has extensive experience in building complex graphs for all domains including Health and Life Sciences. Sanjay has been with SAS for over 25 years and is coauthor of two patents and the author of three SAS Press books.