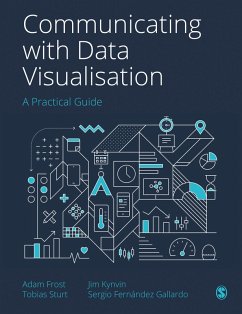
How can you transform a spreadsheet of numbers into a clear, compelling story that your audience will want to pass on?
This book is a step-by-step guide (honed through the authors' Guardian masterclasses, workshops and seminars) to bringing data to life through visualisations, from static charts and maps to interactive infographics and motion graphics.
Introducing a four-step framework to creating engaging and innovative visualisations, it helps you to:
· Find the human stories in your datasets
· Design a visual story that will resonate with your audience
· Make a clear, persuasive visual that represents your data truthfully
· Refine your work to ensure your visual expresses your story in the best possible way.
This book also includes a portfolio of best-practice examples and annotated templates to help you choose the right visual for the right audience, and repurpose your work for different contexts.
Hinweis: Dieser Artikel kann nur an eine deutsche Lieferadresse ausgeliefert werden.
This book is a step-by-step guide (honed through the authors' Guardian masterclasses, workshops and seminars) to bringing data to life through visualisations, from static charts and maps to interactive infographics and motion graphics.
Introducing a four-step framework to creating engaging and innovative visualisations, it helps you to:
· Find the human stories in your datasets
· Design a visual story that will resonate with your audience
· Make a clear, persuasive visual that represents your data truthfully
· Refine your work to ensure your visual expresses your story in the best possible way.
This book also includes a portfolio of best-practice examples and annotated templates to help you choose the right visual for the right audience, and repurpose your work for different contexts.
Dieser Download kann aus rechtlichen Gründen nur mit Rechnungsadresse in A, D ausgeliefert werden.
Hinweis: Dieser Artikel kann nur an eine deutsche Lieferadresse ausgeliefert werden.
This is an enjoyable and informative read from four premier data visualisation experts. Grounded in their award-winning practice and teaching, the authors offer concrete strategies and a wealth of examples for anyone wishing to create intuitive and engaging data visualisations. Penny Sheets Thibaut 20211012

