30,95 €
30,95 €
inkl. MwSt.
Sofort per Download lieferbar
payback
15 °P sammeln
30,95 €
30,95 €
inkl. MwSt.
Sofort per Download lieferbar

Alle Infos zum eBook verschenken
payback
15 °P sammeln
Als Download kaufen
30,95 €
inkl. MwSt.
Sofort per Download lieferbar
payback
15 °P sammeln
Jetzt verschenken
30,95 €
inkl. MwSt.
Sofort per Download lieferbar

Alle Infos zum eBook verschenken
payback
15 °P sammeln
  • Format: PDF

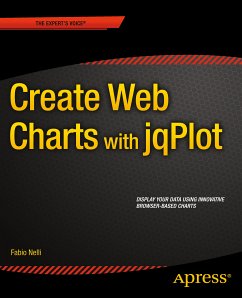
Create Web Charts with jqPlot shows how to convert your data into eye-catching, innovative, animated, and highly interactive browser-based charts. This book is suitable for developers of all experience levels and needs: for those who love fast and effective solutions, you can use the jqPlot library to generate charts with amazing effects and animations using only a few lines of code.
By the end of the book, you will have a good knowledge of all the elements needed to manage data from every possible source, from high-end scientific instruments to Arduino boards, from simple HTML tables to
…mehr

Produktbeschreibung
Create Web Charts with jqPlotshows how to convert your data into eye-catching, innovative, animated, and highly interactive browser-based charts. This book is suitable for developers of all experience levels and needs: for those who love fast and effective solutions, you can use the jqPlot library to generate charts with amazing effects and animations using only a few lines of code.

By the end of the book, you will have a good knowledge of all the elements needed to manage data from every possible source, from high-end scientific instruments to Arduino boards, from simple HTML tables to structured JSON files, and from Matlab calculations to reports in Excel. You will be able to provide cutting-edge charts exploiting the growing power of modern browsers.

This book contains content previously published in Beginning JavaScript Charts.

  • Create all kinds of charts using the latest technologies available on browsers
  • Full of step-by-step examples, Create Web Charts with jqPlot introduces you gradually to all aspects of chart development, from the data source to the choice of which solution to apply.
  • This book provides a number of tools that can be the starting point for any project requiring graphical representations of data, whether using commercial libraries or your own

Dieser Download kann aus rechtlichen Gründen nur mit Rechnungsadresse in A, B, BG, CY, CZ, D, DK, EW, E, FIN, F, GR, HR, H, IRL, I, LT, L, LR, M, NL, PL, P, R, S, SLO, SK ausgeliefert werden.

Autorenporträt
Fabio Nelli, is an IT Scientific Application Specialist at IRBM Science Park, a private research center in Pomezia, Roma (Italy). He has beena computer consultant for many years at IBM, EDS, Merck Sharp, and Dohme, along with several banks and insurance companies.He has an Organic Chemistry degree and many years of experience in Information technologies and Automation systems applied to Life Sciences (Tech Specialist at Beckman Coulter Italy and Spain).He is currently developing Java applications that interface Oracle databases with scientific instrumentations generating data and web server applications providing analysis of the results to researchers in real time.