Sie sind bereits eingeloggt. Klicken Sie auf 2. tolino select Abo, um fortzufahren.
Bitte loggen Sie sich zunächst in Ihr Kundenkonto ein oder registrieren Sie sich bei bücher.de, um das eBook-Abo tolino select nutzen zu können.
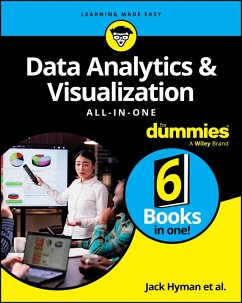
Install data analytics into your brain with this comprehensive introduction Data Analytics & Visualization All-in-One For Dummies collects the essential information on mining, organizing, and communicating data, all in one place. Clocking in at around 850 pages, this tome of a reference delivers eight books in one, so you can build a solid foundation of knowledge in data wrangling. Data analytics professionals are highly sought after these days, and this book will put you on the path to becoming one. You'll learn all about sources of data like data lakes, and you'll discover how to extract…mehr
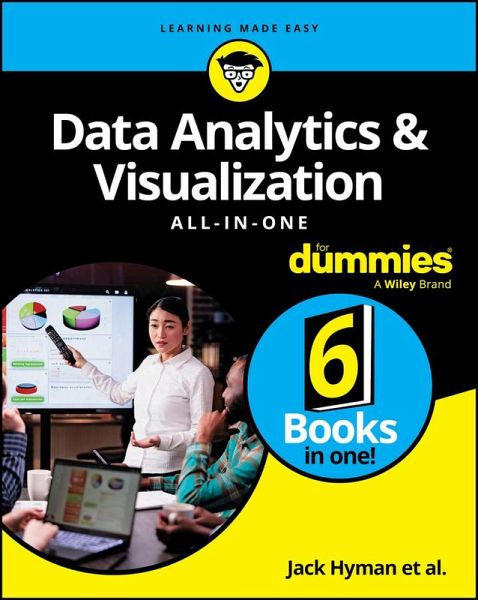
Install data analytics into your brain with this comprehensive introduction Data Analytics & Visualization All-in-One For Dummies collects the essential information on mining, organizing, and communicating data, all in one place. Clocking in at around 850 pages, this tome of a reference delivers eight books in one, so you can build a solid foundation of knowledge in data wrangling. Data analytics professionals are highly sought after these days, and this book will put you on the path to becoming one. You'll learn all about sources of data like data lakes, and you'll discover how to extract data using tools like Microsoft Power BI, organize the data in Microsoft Excel, and visually present the data in a way that makes sense using a Tableau. You'll even get an intro to the Python, R, and SQL coding needed to take your data skills to a new level. With this Dummies guide, you'll be well on your way to becoming a priceless data jockey. * Mine data from data sources * Organize and analyze data * Use data to tell a story with Tableau * Expand your know-how with Python and R New and novice data analysts will love this All-in-One reference on how to make sense of data. Get ready to watch as your career in data takes off.
Dieser Download kann aus rechtlichen Gründen nur mit Rechnungsadresse in D ausgeliefert werden.
This All-in-One draws on the work of top authors in the For Dummies series who've created books designed to help data professionals do their work. The experts are Jack Hyman, Luca Massaron, Paul McFedries, John Paul Mueller, Lillian Pierson, Jonathan Reichental PhD, Joseph Schmuller PhD, Alan Simon, and Allen G. Taylor.
Inhaltsangabe
Introduction 1 Book 1: Learning Data Analytics & Visualizations Foundations 7 Chapter 1: Exploring Definitions and Roles 9 Chapter 2: Delving into Big Data 19 Chapter 3: Understanding Data Lakes 41 Chapter 4: Wrapping Your Head Around Data Science 51 Chapter 5: Telling Powerful Stories with Data Visualization 81 Book 2: Using Power BI for Data Analytics & Visualization 107 Chapter 1: Power BI Foundations 109 Chapter 2: The Quick Tour of Power BI 123 Chapter 3: Prepping Data for Visualization 141 Chapter 4: Tweaking Data for Primetime 167 Chapter 5: Designing and Deploying Data Models 183 Chapter 6: Tackling Visualization Basics in Power BI 203 Chapter 7: Digging into Complex Visualization and Table Data 227 Chapter 8: Sharing and Collaborating with Power BI 247 Book 3: Using Tableau for Data Analytics & Visualization 265 Chapter 1: Tableau Foundations 267 Chapter 2: Connecting Your Data 285 Chapter 3: Diving into the Tableau Prep Lifecycle 313 Chapter 4: Advanced Data Prep Approaches in Tableau 337 Chapter 5: Touring Tableau Desktop 351 Chapter 6: Storytelling Foundations in Tableau 371 Chapter 7: Visualizing Data in Tableau 391 Chapter 8: Collaborating and Publishing with Tableau Cloud 425 Book 4: Extracting Information with SQL 443 Chapter 1: SQL Foundations 445 Chapter 2: Drilling Down to the SQL Nitty-Gritty 455 Chapter 3: Values, Variables, Functions, and Expressions 487 Chapter 4: SELECT Statements and Modifying Clauses 513 Chapter 5: Tuning Queries 539 Chapter 6: Complex Query Design 557 Chapter 7: Joining Data Together in SQL 591 Book 5: Performing Statistical Data Analysis & Visualization with R Programming 605 Chapter 1: Using Open Source R for Data Science 607 Chapter 2: R: What It Does and How It Does It 623 Chapter 3: Getting Graphical 651 Chapter 4: Kicking It Up a Notch to ggplot2 671 Book 6: Applying Python Programming to Data Science 689 Chapter 1: Discovering the Match between Data Science and Python 691 Chapter 2: Using Python for Data Science and Visualization 703 Chapter 3: Getting a Crash Course in Matplotlib 721 Chapter 4: Visualizing the Data 739 Index 761
Es gelten unsere Allgemeinen Geschäftsbedingungen: www.buecher.de/agb
Impressum
www.buecher.de ist ein Internetauftritt der buecher.de internetstores GmbH
Geschäftsführung: Monica Sawhney | Roland Kölbl | Günter Hilger
Sitz der Gesellschaft: Batheyer Straße 115 - 117, 58099 Hagen
Postanschrift: Bürgermeister-Wegele-Str. 12, 86167 Augsburg
Amtsgericht Hagen HRB 13257
Steuernummer: 321/5800/1497