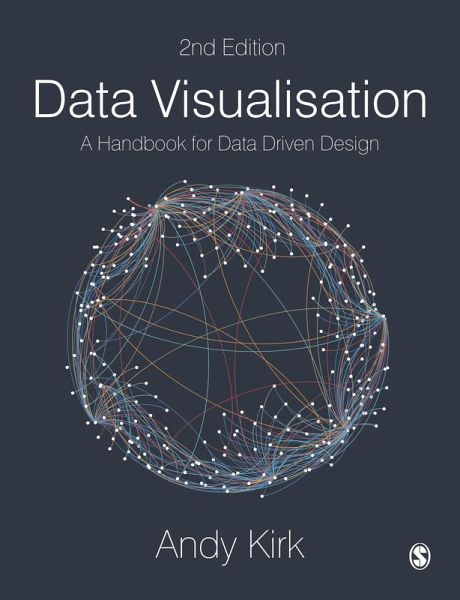
Data Visualisation (eBook, ePUB)
A Handbook for Data Driven Design
Versandkostenfrei!
Sofort per Download lieferbar
47,95 €
inkl. MwSt.
Weitere Ausgaben:

PAYBACK Punkte
24 °P sammeln!
One of the "six best books for data geeks" - Financial TimesWith over 200 images and extensive how-to and how-not-to examples, this new edition has everything students and scholars need to understand and create effective data visualisations.Combining 'how to think' instruction with a 'how to produce' mentality, this book takes readers step-by-step through analysing, designing, and curating information into useful, impactful tools of communication.With this book and its extensive collection of online support, readers can: Decide what visualisations work best for their data and their audience u...
One of the "six best books for data geeks" - Financial Times
With over 200 images and extensive how-to and how-not-to examples, this new edition has everything students and scholars need to understand and create effective data visualisations.
Combining 'how to think' instruction with a 'how to produce' mentality, this book takes readers step-by-step through analysing, designing, and curating information into useful, impactful tools of communication.
With this book and its extensive collection of online support, readers can:
- Decide what visualisations work best for their data and their audience using the chart gallery
- See data visualisation in action and learn the tools to try it themselves
- Follow online checklists, tutorials, and exercises to build skills and confidence
- Get advice from the UK's leading data visualisation trainer on everything from getting started to honing the craft.
Dieser Download kann aus rechtlichen Gründen nur mit Rechnungsadresse in A, D ausgeliefert werden.


