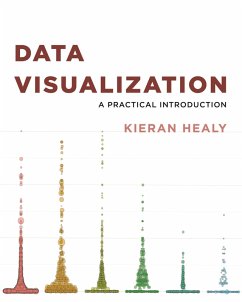
Data Visualization (eBook, ePUB)
A Practical Introduction
Versandkostenfrei!
Sofort per Download lieferbar
32,95 €
inkl. MwSt.
Weitere Ausgaben:

PAYBACK Punkte
16 °P sammeln!
An accessible primer on how to create effective graphics from dataThis book provides students and researchers a hands-on introduction to the principles and practice of data visualization. It explains what makes some graphs succeed while others fail, how to make high-quality figures from data using powerful and reproducible methods, and how to think about data visualization in an honest and effective way.Data Visualization builds the reader's expertise in ggplot2, a versatile visualization library for the R programming language. Through a series of worked examples, this accessible primer then d...
An accessible primer on how to create effective graphics from data
This book provides students and researchers a hands-on introduction to the principles and practice of data visualization. It explains what makes some graphs succeed while others fail, how to make high-quality figures from data using powerful and reproducible methods, and how to think about data visualization in an honest and effective way.
Data Visualization builds the reader's expertise in ggplot2, a versatile visualization library for the R programming language. Through a series of worked examples, this accessible primer then demonstrates how to create plots piece by piece, beginning with summaries of single variables and moving on to more complex graphics. Topics include plotting continuous and categorical variables; layering information on graphics; producing effective "small multiple" plots; grouping, summarizing, and transforming data for plotting; creating maps; working with the output of statistical models; and refining plots to make them more comprehensible.
Effective graphics are essential to communicating ideas and a great way to better understand data. This book provides the practical skills students and practitioners need to visualize quantitative data and get the most out of their research findings.
- Provides hands-on instruction using R and ggplot2
- Shows how the "tidyverse" of data analysis tools makes working with R easier and more consistent
- Includes a library of data sets, code, and functions
Dieser Download kann aus rechtlichen Gründen nur mit Rechnungsadresse in A, D ausgeliefert werden.


