57,95 €
57,95 €
inkl. MwSt.
Sofort per Download lieferbar
payback
29 °P sammeln
57,95 €
57,95 €
inkl. MwSt.
Sofort per Download lieferbar

Alle Infos zum eBook verschenken
payback
29 °P sammeln
Als Download kaufen
57,95 €
inkl. MwSt.
Sofort per Download lieferbar
payback
29 °P sammeln
Jetzt verschenken
57,95 €
inkl. MwSt.
Sofort per Download lieferbar

Alle Infos zum eBook verschenken
payback
29 °P sammeln
  • Format: PDF

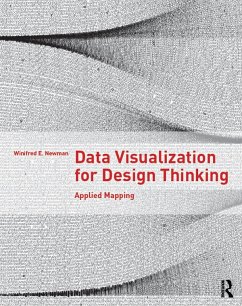
More than 100 examples illustrated with over 200 color images show you how to visualize data through mapping. Includes five in-depth cases studies and numerous examples throughout.

  • Geräte: PC
  • mit Kopierschutz
  • eBook Hilfe
  • Größe: 258.55MB
Produktbeschreibung
More than 100 examples illustrated with over 200 color images show you how to visualize data through mapping. Includes five in-depth cases studies and numerous examples throughout.


Dieser Download kann aus rechtlichen Gründen nur mit Rechnungsadresse in A, B, BG, CY, CZ, D, DK, EW, E, FIN, F, GR, HR, H, IRL, I, LT, L, LR, M, NL, PL, P, R, S, SLO, SK ausgeliefert werden.

Autorenporträt
Winifred E. Newman is professor and head of the department of architecture at the University of Arkansas in Fayetteville, Arkansas, USA.