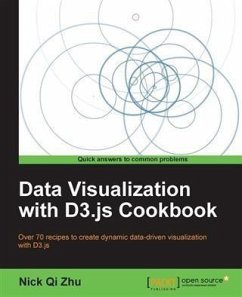
"Data Visualization with D3.js Cookbook" is packed with practical recipes to help you learn every aspect of data visualization with D3.
"Data Visualization with D3.js Cookbook" is designed to provide you with all the guidance you need to get to grips with data visualization with D3. With this book, you will create breathtaking data visualization with professional efficiency and precision with the help of practical recipes, illustrations, and code samples.
"Data Visualization with D3.js Cookbook" starts off by touching upon data visualization and D3 basics before gradually taking you through a number of practical recipes covering a wide range of topics you need to know about D3.
You will learn the fundamental concepts of data visualization, functional JavaScript, and D3 fundamentals including element selection, data binding, animation, and SVG generation. You will also learn how to leverage more advanced techniques such as custom interpolators, custom tweening, timers, the layout manager, force manipulation, and so on. This book also provides a number of pre-built chart recipes with ready-to-go sample code to help you bootstrap quickly.
Dieser Download kann aus rechtlichen Gründen nur mit Rechnungsadresse in A, B, BG, CY, CZ, D, DK, EW, E, FIN, F, GR, HR, H, IRL, I, LT, L, LR, M, NL, PL, P, R, S, SLO, SK ausgeliefert werden.

