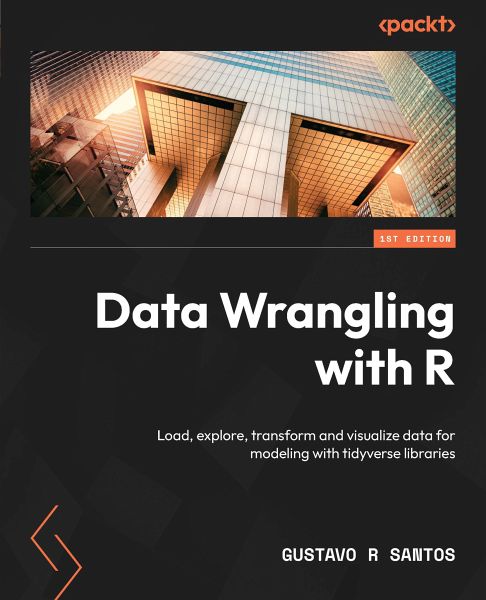
Data Wrangling with R (eBook, ePUB)
Load, explore, transform and visualize data for modeling with tidyverse libraries
Versandkostenfrei!
Sofort per Download lieferbar
32,39 €
inkl. MwSt.
Weitere Ausgaben:

PAYBACK Punkte
0 °P sammeln!
In this information era, where large volumes of data are being generated every day, companies want to get a better grip on it to perform more efficiently than before. This is where skillful data analysts and data scientists come into play, wrangling and exploring data to generate valuable business insights. In order to do that, you'll need plenty of tools that enable you to extract the most useful knowledge from data. Data Wrangling with R will help you to gain a deep understanding of ways to wrangle and prepare datasets for exploration, analysis, and modeling. This data book enables you to ge...
In this information era, where large volumes of data are being generated every day, companies want to get a better grip on it to perform more efficiently than before. This is where skillful data analysts and data scientists come into play, wrangling and exploring data to generate valuable business insights. In order to do that, you'll need plenty of tools that enable you to extract the most useful knowledge from data. Data Wrangling with R will help you to gain a deep understanding of ways to wrangle and prepare datasets for exploration, analysis, and modeling. This data book enables you to get your data ready for more optimized analyses, develop your first data model, and perform effective data visualization. The book begins by teaching you how to load and explore datasets. Then, you'll get to grips with the modern concepts and tools of data wrangling. As data wrangling and visualization are intrinsically connected, you'll go over best practices to plot data and extract insights from it. The chapters are designed in a way to help you learn all about modeling, as you will go through the construction of a data science project from end to end, and become familiar with the built-in RStudio, including an application built with Shiny dashboards. By the end of this book, you'll have learned how to create your first data model and build an application with Shiny in R.
Dieser Download kann aus rechtlichen Gründen nur mit Rechnungsadresse in A, B, BG, CY, CZ, D, DK, EW, E, FIN, F, GR, H, IRL, I, LT, L, LR, M, NL, PL, P, R, S, SLO, SK ausgeliefert werden.


