133,95 €
133,95 €
inkl. MwSt.
Erscheint vor. 29.03.25
67 °P sammeln
133,95 €
Als Download kaufen
133,95 €
inkl. MwSt.
Erscheint vor. 29.03.25
67 °P sammeln
Jetzt verschenken
Alle Infos zum eBook verschenken
133,95 €
inkl. MwSt.
Erscheint vor. 29.03.25
Alle Infos zum eBook verschenken
67 °P sammeln
Unser Service für Vorbesteller - Ihr Vorteil ohne Risiko:
Sollten wir den Preis dieses Artikels vor dem Erscheinungsdatum senken, werden wir Ihnen den Artikel bei der Auslieferung automatisch zum günstigeren Preis berechnen.
- Format: ePub
- Merkliste
- Auf die Merkliste
- Bewerten Bewerten
- Teilen
- Produkt teilen
- Produkterinnerung
- Produkterinnerung
Bitte loggen Sie sich zunächst in Ihr Kundenkonto ein oder registrieren Sie sich bei
bücher.de, um das eBook-Abo tolino select nutzen zu können.
Hier können Sie sich einloggen
Sie sind bereits eingeloggt. Klicken Sie auf 2. tolino select Abo, um fortzufahren.
Bitte loggen Sie sich zunächst in Ihr Kundenkonto ein oder registrieren Sie sich bei bücher.de, um das eBook-Abo tolino select nutzen zu können.
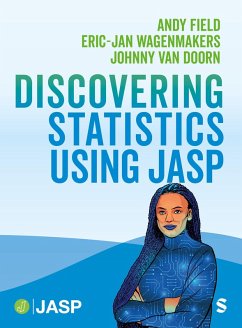
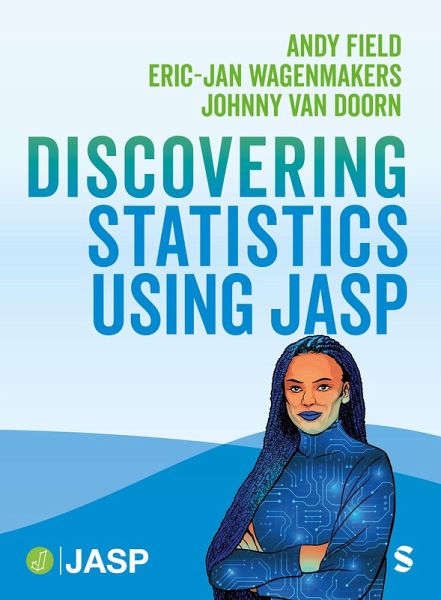
A new textbook from statistics royalty that builds on a world-class brand to present core statistical techniques alongside an up-and-coming software created by the authors - JASP.
- Geräte: eReader
- mit Kopierschutz
- eBook Hilfe
Andere Kunden interessierten sich auch für
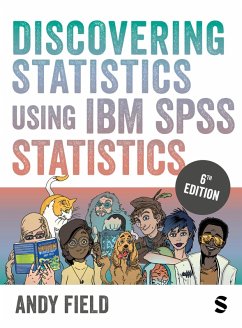
- Andy FieldDiscovering Statistics Using IBM SPSS Statistics (eBook, ePUB)133,95 €
- Andy FieldDiscovering Statistics Using IBM SPSS Statistics (eBook, ePUB)134,95 €
- Andy FieldDiscovering Statistics Using R (eBook, ePUB)87,95 €
- Sigmund GronmoSocial Research Methods (eBook, ePUB)41,95 €
- Kathy CharmazConstructing Grounded Theory (eBook, ePUB)47,95 €
- Brian J FogartyQuantitative Social Science Data with R (eBook, ePUB)41,95 €
-
-
-
A new textbook from statistics royalty that builds on a world-class brand to present core statistical techniques alongside an up-and-coming software created by the authors - JASP.
Dieser Download kann aus rechtlichen Gründen nur mit Rechnungsadresse in A, D ausgeliefert werden.
Produktdetails
- Produktdetails
- Verlag: SAGE Publications
- Erscheinungstermin: 29. März 2025
- Englisch
- ISBN-13: 9781036202071
- Artikelnr.: 72262331
- Verlag: SAGE Publications
- Erscheinungstermin: 29. März 2025
- Englisch
- ISBN-13: 9781036202071
- Artikelnr.: 72262331
- Herstellerkennzeichnung Die Herstellerinformationen sind derzeit nicht verfügbar.
Andy Field is Professor of Quantitative Methods at the University of Sussex. He has published widely (100+ research papers, 29 book chapters, and 17 books in various editions) in the areas of child anxiety and psychological methods and statistics. His current research interests focus on barriers to learning mathematics and statistics.
He is internationally known as a statistics educator. He has written several widely used statistics textbooks including Discovering Statistics Using IBM SPSS Statistics (winner of the 2007 British Psychological Society book award), Discovering Statistics Using R, and An Adventure in Statistics (shortlisted for the British Psychological Society book award, 2017; British Book Design and Production Awards, primary, secondary and tertiary education category, 2016; and the Association of Learned & Professional Society Publishers Award for innovation in publishing, 2016), which teaches statistics through a fictional narrative and uses graphic novel elements. He has also written the adventr and discovr packages for the statistics software R that teach statistics and R through interactive tutorials.
His uncontrollable enthusiasm for teaching statistics to psychologists has led to teaching awards from the University of Sussex (2001, 2015, 2016, 2018, 2019), the British Psychological Society (2006) and a prestigious UK National Teaching fellowship (2010).
He's done the usual academic things: had grants, been on editorial boards, done lots of admin/service but he finds it tedious trying to remember this stuff. None of them matter anyway because in the unlikely event that you've ever heard of him it'll be as the 'Stats book guy'. In his spare time, he plays the drums very noisily in a heavy metal band, and walks his cocker spaniel, both of which he finds therapeutic.
1. Why is my evil lecturer forcing me to learn statistics?
2. The SPINE of statistics
3. The phoenix of statistics
4. The JASP environment
5. Visualizing data
6. The beast of bias
7. Correlation
8. The linear model (regression)
9. Categorical predictors: Comparing two means
10. Moderation and mediation
11. GLM 1: Comparing several independent means
12. GLM 2: Comparing means adjusted for other predictors (analysis of
covariance)
13. GLM 3: Factorial designs
14. GLM 4: Repeated-measures designs
15. Non-parametric models
16. Categorical outcomes: chi-square
17. Categorical outcomes: logistic regression