52,95 €
52,95 €
inkl. MwSt.
Sofort per Download lieferbar
26 °P sammeln
52,95 €
Als Download kaufen
52,95 €
inkl. MwSt.
Sofort per Download lieferbar
26 °P sammeln
Jetzt verschenken
Alle Infos zum eBook verschenken
52,95 €
inkl. MwSt.
Sofort per Download lieferbar
Alle Infos zum eBook verschenken
26 °P sammeln
- Format: ePub
- Merkliste
- Auf die Merkliste
- Bewerten Bewerten
- Teilen
- Produkt teilen
- Produkterinnerung
- Produkterinnerung
Bitte loggen Sie sich zunächst in Ihr Kundenkonto ein oder registrieren Sie sich bei
bücher.de, um das eBook-Abo tolino select nutzen zu können.
Hier können Sie sich einloggen
Sie sind bereits eingeloggt. Klicken Sie auf 2. tolino select Abo, um fortzufahren.
Bitte loggen Sie sich zunächst in Ihr Kundenkonto ein oder registrieren Sie sich bei bücher.de, um das eBook-Abo tolino select nutzen zu können.
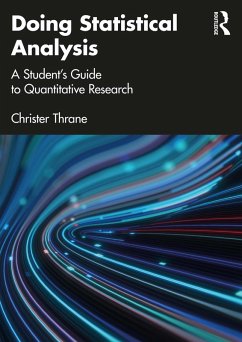
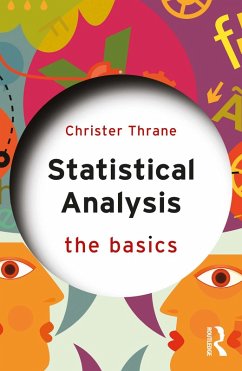
Doing Statistical Analysis looks at three kinds of statistical research questions - descriptive, associational and inferential - and shows students how to conduct statistical analyses and interpret the results.
- Geräte: eReader
- ohne Kopierschutz
- eBook Hilfe
- Größe: 24.11MB
Andere Kunden interessierten sich auch für
- Christer ThraneDoing Statistical Analysis (eBook, PDF)52,95 €
- David W. GerbingR Data Analysis without Programming (eBook, ePUB)52,95 €
- Lisa L. HarlowThe Essence of Multivariate Thinking (eBook, ePUB)54,95 €
- A. Alexander BeaujeanLatent Variable Modeling Using R (eBook, ePUB)50,95 €
- John P. HoffmannLinear Regression Models (eBook, ePUB)72,95 €
- David W. GerbingR Data Analysis without Programming (eBook, PDF)52,95 €
- Ronald H. HeckMultilevel and Longitudinal Modeling with IBM SPSS (eBook, ePUB)50,95 €
-
-
-
Doing Statistical Analysis looks at three kinds of statistical research questions - descriptive, associational and inferential - and shows students how to conduct statistical analyses and interpret the results.
Dieser Download kann aus rechtlichen Gründen nur mit Rechnungsadresse in A, B, BG, CY, CZ, D, DK, EW, E, FIN, F, GR, HR, H, IRL, I, LT, L, LR, M, NL, PL, P, R, S, SLO, SK ausgeliefert werden.
Produktdetails
- Produktdetails
- Verlag: Taylor & Francis
- Seitenzahl: 266
- Erscheinungstermin: 29. Juli 2022
- Englisch
- ISBN-13: 9781000620672
- Artikelnr.: 64258669
- Verlag: Taylor & Francis
- Seitenzahl: 266
- Erscheinungstermin: 29. Juli 2022
- Englisch
- ISBN-13: 9781000620672
- Artikelnr.: 64258669
- Herstellerkennzeichnung Die Herstellerinformationen sind derzeit nicht verfügbar.
Christer Thrane holds a PhD in Sociology and is Professor at Inland Norway University of Applied Science - Inland School of Business and Social Sciences. His research interests include quantitative modeling studies in leisure, sports, and tourism. He has 25 years of experience teaching quantitative research methods, and he has written several textbooks on this topic.
Acknowledgments
1. What is statistical analysis from a research perspective?
1.1 A statistical association: Covid-19 spread and residential property prices
1.2 Why do statistical analysis in research? The book's purpose and pedagogical approach
1.3 Three types of statistical research questions: Descriptive, associational, and inferential
1.4 Some key concepts you really should understand
1.5 Chapter summary, key learning points, and the organization of the rest of the book
2. Descriptive research questions
2.1 Introduction and chapter overview
2.2 What is typical? Three measures of central tendency: Mean, median, and mode
2.3 Variables' measurement levels: Continuous or categorical variables
2.4 Ordinal variables: A third and special-case measurement level
2.5 Visual presentation of descriptive statistics: Graphs
2.6 The concept of variation: Statistical spread for continuous variables
2.7 Foreshadowing associational research questions: Descriptive statistics for subgroups
2.8 Chapter summary, key learning points, and further reading
2.9 Executing statistical commands: do-files in Stata and syntax-files in SPSS
2.10 Chapter exercises with solutions
Appendix A: Christmas beer data
Appendix B: Soccer data
Appendix C: Student exercise data
3. Associational research questions I: Bivariate analysis
3.1 Introduction: The association between two variables, x and y
3.2 A categorical x and a categorical y: Cross-tabulation
3.3 A categorical x and a continuous y: ANOVA
3.4 A continuous x and a continuous y: Regression analysis
3.5 An ordinal y and bivariate analysis
3.6 The limitations of bivariate analysis: The need for statistical control for a third variable
3.7 Experimental control for a third (and fourth) variable
3.8 Chapter summary, key learning points, and further reading
3.9 Do-files in Stata and syntax-files in SPSS
3.10 Chapter exercises with solutions
4. Associational research questions II: Multiple regression
4.1 Introduction and chapter overview
4.2 Statistical control for observational data: Two examples
4.3 The multiple regression model and R2
4.4 Non-linear effects
4.5 Interaction effects (moderator effects)
4.6 Regression on experimental data
4.7 A dummy y
4.8 Chapter summary, key learning points, and further reading
4.9 Do-files in Stata and syntax-files in SPSS
4.10 Chapter exercises with solutions
Appendix A: Student exercise motive data
Appendix B: Student tourism data
Appendix C: Red wine data
5. Inferential research questions
5.1 Introduction and chapter overview
5.2 Samples, populations, and random sampling
5.3 Repeated sampling and the normal distribution
5.4 The 95 percent CI for descriptive statistics: Means and proportions
5.5 The 95 percent CI for variable associations
5.6 Verifying that random sampling and the Central Limit Theorem work as promised
5.7 Hypothesis testing and the assessment of statistical significance
5.8 Critical aspects of significance testing
5.9 Chapter summary, key learning points, and further reading
5.10 Do-files in Stata and syntax-files in SPSS
5.11 Chapter exercises with solutions
6. Doing quantitative research: Some tricks of the trade
6.1 Introduction and chapter overview
6.2 Creating, recoding, and labeling new variables
6.3 Creating a new variable by combining existing variables
6.4 Missing data and what to do about them
6.5 Outliers: When too much information causes trouble
6.6 The assumptions of regression analysis
6.7 Effect sizes
6.8 How to present and communicate statistical-association results
6.9 Chapter summary, key learning points, and further reading
6.10 Statistical commands: Do-files in Stata and syntax-files in SPSS
6.11 Chapter exercises with solutions
Appendix A: Female student weight data
References
Index