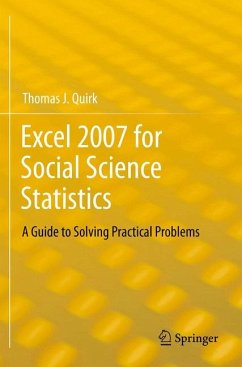
Excel 2010 for Social Science Statistics (eBook, PDF)
A Guide to Solving Practical Problems
Versandkostenfrei!
Sofort per Download lieferbar
40,95 €
inkl. MwSt.
Weitere Ausgaben:

PAYBACK Punkte
20 °P sammeln!
This is the first book to show the capabilities of Microsoft Excel to teach social science statistics effectively. It is a step-by-step exercise-driven guide for students and practitioners who need to master Excel to solve practical social science problems. If understanding statistics isn't your strongest suit, you are not especially mathematically-inclined, or if you are wary of computers, this is the right book for you.Excel, a widely available computer program for students and managers, is also an effective teaching and learning tool for quantitative analyses in social science courses. Its ...
This is the first book to show the capabilities of Microsoft Excel to teach social science statistics effectively. It is a step-by-step exercise-driven guide for students and practitioners who need to master Excel to solve practical social science problems. If understanding statistics isn't your strongest suit, you are not especially mathematically-inclined, or if you are wary of computers, this is the right book for you.
Excel, a widely available computer program for students and managers, is also an effective teaching and learning tool for quantitative analyses in social science courses. Its powerful computational ability and graphical functions make learning statistics much easier than in years past. However, Excel 2010 for Social Science Statistics: A Guide to Solving Practical Statistics Problems is the first book to capitalize on these improvements by teaching students and managers how to apply Excel to statistical techniques necessary in their courses and work.
Each chapter explains statistical formulas and directs the reader to use Excel commands to solve specific, easy-to-understand social science problems. Practice problems are provided at the end of each chapter with their solutions in an Appendix. Separately, there is a full Practice Test (with answers in an Appendix) that allows readers to test what they have learned.
Each chapter explains statistical formulas and directs the reader to use Excel commands to solve specific, easy-to-understand social science problems. Practice problems are provided at the end of each chapter with their solutions in an Appendix. Separately, there is a full Practice Test (with answers in an Appendix) that allows readers to test what they have learned.
Includes 164 Illustrations in color.
Dieser Download kann aus rechtlichen Gründen nur mit Rechnungsadresse in A, B, BG, CY, CZ, D, DK, EW, E, FIN, F, GR, HR, H, IRL, I, LT, L, LR, M, NL, PL, P, R, S, SLO, SK ausgeliefert werden.


