Jim Duggan
Exploring Operations Research with R (eBook, ePUB)
65,95 €
65,95 €
inkl. MwSt.
Sofort per Download lieferbar
33 °P sammeln
65,95 €
Als Download kaufen
65,95 €
inkl. MwSt.
Sofort per Download lieferbar
33 °P sammeln
Jetzt verschenken
Alle Infos zum eBook verschenken
65,95 €
inkl. MwSt.
Sofort per Download lieferbar
Alle Infos zum eBook verschenken
33 °P sammeln
Jim Duggan
Exploring Operations Research with R (eBook, ePUB)
- Format: ePub
- Merkliste
- Auf die Merkliste
- Bewerten Bewerten
- Teilen
- Produkt teilen
- Produkterinnerung
- Produkterinnerung
Bitte loggen Sie sich zunächst in Ihr Kundenkonto ein oder registrieren Sie sich bei
bücher.de, um das eBook-Abo tolino select nutzen zu können.
Hier können Sie sich einloggen
Sie sind bereits eingeloggt. Klicken Sie auf 2. tolino select Abo, um fortzufahren.
Bitte loggen Sie sich zunächst in Ihr Kundenkonto ein oder registrieren Sie sich bei bücher.de, um das eBook-Abo tolino select nutzen zu können.
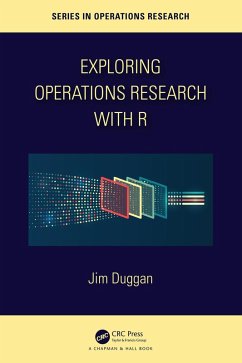
The core aim of the book is to provide a self-contained introduction to R (both Base R and the tidyverse) and show how this knowledge can be applied to a range of OR challenges in the domains of public health, infectious diseases, and energy generation, and so provide a platform to develop actionable insights to support decision making.
- Geräte: eReader
- ohne Kopierschutz
- eBook Hilfe
- Größe: 6.34MB
The core aim of the book is to provide a self-contained introduction to R (both Base R and the tidyverse) and show how this knowledge can be applied to a range of OR challenges in the domains of public health, infectious diseases, and energy generation, and so provide a platform to develop actionable insights to support decision making.
Dieser Download kann aus rechtlichen Gründen nur mit Rechnungsadresse in A, B, BG, CY, CZ, D, DK, EW, E, FIN, F, GR, HR, H, IRL, I, LT, L, LR, M, NL, PL, P, R, S, SLO, SK ausgeliefert werden.
Produktdetails
- Produktdetails
- Verlag: Taylor & Francis
- Seitenzahl: 408
- Erscheinungstermin: 21. Mai 2024
- Englisch
- ISBN-13: 9781040010068
- Artikelnr.: 70427112
- Verlag: Taylor & Francis
- Seitenzahl: 408
- Erscheinungstermin: 21. Mai 2024
- Englisch
- ISBN-13: 9781040010068
- Artikelnr.: 70427112
- Herstellerkennzeichnung Die Herstellerinformationen sind derzeit nicht verfügbar.
Jim Duggan is a Personal Professor in Computer Science at the University of Galway, Ireland. He lectures on R, MATLAB®, and system dynamics, and he is a certified RStudio tidyverse instructor. His research interests are interdisciplinary and focus on the use of simulation and computational methods to support public health policy. You can learn more about his work on R and computation modelling on his GitHub site https://github.com/JimDuggan.
1. Getting Started with R. 1.1. Introduction. 1.2. Exploring R via the
RStudio console. 1.3. Calling functions. 1.4. Installing packages. 1.6.
Next Steps. 2. Vectors. 2.1. Introduction. 2.2. Atomic Vectors. 2.3.
Vectorisation. 2.4. Lists. 2.5. Mini-Case: Two-dice rolls with Atomic
Vectors. 2.6. Summary of R Functions from Chapter 2. 2.7. Exercises. 3.
Subsetting Vectors. 3.1. Introduction. 3.2. Subsetting Atomic Vectors. 3.3.
Subsetting Lists. 3.4. Iteration using Loops, and the if statement. 3.5.
Mini-Case: Starwars Movies. 3.6. Summary of R Functions from Chapter 3.
3.7. Exercises. 4. Functions, Functionals and the R Pipe. 4.1.
Introduction. 4.2. Functions. 4.3. Passing arguments to functions. 4.4.
Error checking for functions. 4.5. Environments and Functions. 4.6.
Functionals with lapply. 4.7. Mini-Case: Starwars Movies (Revisited) using
Functionals. 4.8. Creating a data processing pipeline using R's native pipe
operator. 4.9. Summary of R Functions from Chapter 4. 4.10. Exercises. 5.
Matrices and Data Frames. 5.1. Introduction. 5.2. Matrices. 5.3. Data
Frames. 5.4. R functions for processing data frames: subset() and
transform(). 5.5. Tibbles. 5.6. Functionals on matrices and data frames.
5.8. Mini-Case 2: A Pipeline for Processing data frames. 5.9. Summary of R
Functions from Chapter 5. 5.10. Exercises. 6. The S3 Object System in R.
6.1. Introduction. 6.2. S3 in Action. 6.3. Objects, Attributes and Defining
S3 Classes. 6.4. The Generic Function Approach. 6.5. Using an Existing
Generic Function. 6.6. Custom-Built Generic Functions. 6.7. Inheritance
with S3. 6.8. Mini-Case: Creating a Queue S3 Object. 6.9. Summary of R
Functions from Chapter 6. 6.10. Exercises. I. Base R. 7. Visualisation with
ggplot2. 7.1. Introduction. 7.2. Two datasets from ggplot2 - mpg and
diamonds. 7.3. Exploring relationships with a scatterplot. 7.4. Aesthetic
mappings. 7.5. Subplots with Facets. 7.6. Statistical Transformations. 7.7.
Themes. 7.8. Adding lines to a plot. 7.9. Mini-Case: Visualising the Impact
of Storm Ophelia. 7.10. Summary of R Functions from Chapter 7. 7.11.
Exercises. 8. Data Transformation with dplyr. 8.1. Introduction. 8.2. The
tidyverse Pipe - magrittr. 8.3. Filtering rows with filter(). 8.4. Sorting
rows with arrange(). 8.5. Choosing columns with select(). 8.6. Adding
columns with mutate(). 8.7. Summarising observations with summarise(). 8.8.
Additional dplyr functions. 8.9. Mini-Case: Summarising total rainfall in
2017. 8.10. Summary of R Functions from Chapter 8. 8.11. Exercises. 9.
Relational data with dplyr and tidying data with tidyr. 9.1. Introduction.
9.2. Relational data. 9.3. Mutating joins. 9.4. Filtering joins. 9.5. Tidy
Data. 9.6. Making data longer using pivot_longer. 9.7. Making data wider
using pivot_wider(). 9.8. Mini-Case: exploring correlations relating to
wind energy generation. 9.9. Summary of R Functions from Chapter 9. 9.10.
Exercises. 10. Processing data with purr. 10.1. Introduction. 10.2.
Iteration using map(). 10.3. Additional map_* functions. 10.4. Iterating
over two inputs using map2() and pmap(). 10.5. Integrating purrr with dplyr
and tidyr to process tibbles. 10.6. Additional purrr functions. 10.7.
Mini-Case: generating linear models from the mpg dataset. 10.8. Summary of
R Functions from Chapter 10. 10.9. Exercises. 11. Shiny. 11.1.
Introduction. 11.2. Reactive Programming. 11.3. Example one: hello shiny.
11.4. Example two: squaring an input number. 11.5. Example three: exploring
a weather station. 11.6 Example four: comparing two weather stations. 11.7.
Example five: creating a scatter plot. 11.8 Example six: improving design
by adding reactive expressions. 11.9. Summary of R Functions from Chapter
11. 11.10. Exercises. II. The tidyverse and Shiny. 12. Exploratory Data
Analysis. 12.1. Introduction. 12.2. Exploratory Data Analysis. 12.3
Identifying species of iris using plant measurements. 12.4. Exploring
electricity demand in Victoria, Australia. 12.5. Exploring housing values
in the Boston suburbs. 12.6. Exploring passenger survival chances on board
the Titanic. 12.7. Exploring the effect of wind direction on winter
temperatures in Ireland. 12.8. Summary of R Functions from Chapter 12. 13.
Linear Programming. 13.1. Introduction. 13.2. Linear Programming - An
overview. 13.3. The Reddy Mikks example. 13.4. Exploring a two-variable
decision space using R. 13.5. A Graphical Solution to the Reddy Mixx
Problem. 13.6. lpSolve: Generating Optimal Solutions in R. 13.7.
Sensitivity Analysis using lpSolve. 13.8. Summary of R Functions from
Chapter 13. 14. Agent Based Simulation. 14.1. Introduction. 14.2. Networks
and the igraph package. 14.3 Agent Design - The Adopter Marketing Problem.
14.4. Simulator Design and Data Structures. 14.5. Simulation Code. 14.6.
Summary of R Functions from Chapter 14. 15. System Dynamics. 15.1.
Introduction. 15.2. Stocks, Flows and Feedback. 15.3. deSolve. 15.4. The
Susceptible-Infected-Removed Model. 15.5. The
Susceptible-Infected-Recovered-Hospital Model. 15.6. Policy Exploration of
the SIRH Model using Sensitivity Analysis. 15.7. Summary of R Functions
from Chapter.