Harvey Motulsky, Arthur Christopoulos
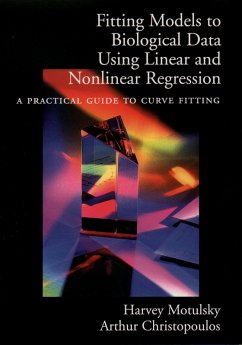
Fitting Models to Biological Data Using Linear and Nonlinear Regression (eBook, PDF)
A Practical Guide to Curve Fitting
45,95 €
45,95 €
inkl. MwSt.
Sofort per Download lieferbar

23 °P sammeln
45,95 €
Als Download kaufen

45,95 €
inkl. MwSt.
Sofort per Download lieferbar

23 °P sammeln
Jetzt verschenken
Alle Infos zum eBook verschenken
45,95 €
inkl. MwSt.
Sofort per Download lieferbar
Alle Infos zum eBook verschenken

23 °P sammeln
Harvey Motulsky, Arthur Christopoulos
Fitting Models to Biological Data Using Linear and Nonlinear Regression (eBook, PDF)
A Practical Guide to Curve Fitting
- Format: PDF
- Merkliste
- Auf die Merkliste
- Bewerten Bewerten
- Teilen
- Produkt teilen
- Produkterinnerung
- Produkterinnerung

Bitte loggen Sie sich zunächst in Ihr Kundenkonto ein oder registrieren Sie sich bei
bücher.de, um das eBook-Abo tolino select nutzen zu können.
Hier können Sie sich einloggen
Hier können Sie sich einloggen
Sie sind bereits eingeloggt. Klicken Sie auf 2. tolino select Abo, um fortzufahren.

Bitte loggen Sie sich zunächst in Ihr Kundenkonto ein oder registrieren Sie sich bei bücher.de, um das eBook-Abo tolino select nutzen zu können.
Most biologists use nonlinear regression more than any other statistical technique, but there are very few places to learn about curve-fitting. This book, by the author of the very successful Intuitive Biostatistics , addresses this relatively focused need of an extraordinarily broad range of scientists.
- Geräte: PC
- mit Kopierschutz
- eBook Hilfe
- Größe: 16.95MB
Andere Kunden interessierten sich auch für
![Bayesian Phylogenetics (eBook, PDF) Bayesian Phylogenetics (eBook, PDF)]() Bayesian Phylogenetics (eBook, PDF)48,95 €
Bayesian Phylogenetics (eBook, PDF)48,95 €![Big Data Analysis for Bioinformatics and Biomedical Discoveries (eBook, PDF) Big Data Analysis for Bioinformatics and Biomedical Discoveries (eBook, PDF)]() Big Data Analysis for Bioinformatics and Biomedical Discoveries (eBook, PDF)48,95 €
Big Data Analysis for Bioinformatics and Biomedical Discoveries (eBook, PDF)48,95 €![Foundational and Applied Statistics for Biologists Using R (eBook, PDF) Foundational and Applied Statistics for Biologists Using R (eBook, PDF)]() Ken A. AhoFoundational and Applied Statistics for Biologists Using R (eBook, PDF)48,95 €
Ken A. AhoFoundational and Applied Statistics for Biologists Using R (eBook, PDF)48,95 €![RNA-seq Data Analysis (eBook, PDF) RNA-seq Data Analysis (eBook, PDF)]() Eija KorpelainenRNA-seq Data Analysis (eBook, PDF)68,95 €
Eija KorpelainenRNA-seq Data Analysis (eBook, PDF)68,95 €![Statistics and Data Analysis for Microarrays Using R and Bioconductor (eBook, PDF) Statistics and Data Analysis for Microarrays Using R and Bioconductor (eBook, PDF)]() Sorin DraghiciStatistics and Data Analysis for Microarrays Using R and Bioconductor (eBook, PDF)101,95 €
Sorin DraghiciStatistics and Data Analysis for Microarrays Using R and Bioconductor (eBook, PDF)101,95 €![Introduction to Computational Biology (eBook, PDF) Introduction to Computational Biology (eBook, PDF)]() Michael S. WatermanIntroduction to Computational Biology (eBook, PDF)134,95 €
Michael S. WatermanIntroduction to Computational Biology (eBook, PDF)134,95 €![Big Data in Omics and Imaging (eBook, PDF) Big Data in Omics and Imaging (eBook, PDF)]() Momiao XiongBig Data in Omics and Imaging (eBook, PDF)50,95 €
Momiao XiongBig Data in Omics and Imaging (eBook, PDF)50,95 €-
-
-
Most biologists use nonlinear regression more than any other statistical technique, but there are very few places to learn about curve-fitting. This book, by the author of the very successful Intuitive Biostatistics, addresses this relatively focused need of an extraordinarily broad range of scientists.
Hinweis: Dieser Artikel kann nur an eine deutsche Lieferadresse ausgeliefert werden.
Dieser Download kann aus rechtlichen Gründen nur mit Rechnungsadresse in A, B, BG, CY, CZ, D, DK, EW, E, FIN, F, GR, HR, H, IRL, I, LT, L, LR, M, NL, PL, P, R, S, SLO, SK ausgeliefert werden.
Hinweis: Dieser Artikel kann nur an eine deutsche Lieferadresse ausgeliefert werden.
Produktdetails
- Produktdetails
- Verlag: OUP eBook
- Erscheinungstermin: 27. Mai 2004
- Englisch
- ISBN-13: 9780198038344
- Artikelnr.: 38127679
- Verlag: OUP eBook
- Erscheinungstermin: 27. Mai 2004
- Englisch
- ISBN-13: 9780198038344
- Artikelnr.: 38127679
- Herstellerkennzeichnung Die Herstellerinformationen sind derzeit nicht verfügbar.
(Professor in the Department of Pharmacology, University of Melbourne, Australia)
* Fitting data with nonlinear regression
* 1: An example of nonlinear regression
* 2: Preparing data for nonlinear regression
* 3: Nonlinear regression choices
* 4: The first five questions to ask about nonlinear regression results
* 5: The results of nonlinear regression
* 6: Troubleshooting "bad fits"
* Fitting data with linear regression
* 7: Choosing linear regression
* 8: Interpreting the results of linear regression
* Models
* 9: Introducing models
* 10: Tips on choosing a model
* 11: Global models
* 12: Compartmental models and defining a model with a differential
equation
* How nonlinear regression works
* 13: Modeling experimental error
* 14: Unequal weighting of data points
* 15: How nonlinear regression minimized the sum-of-squares
* Confidence intervals of the parameters
* 16: Asymptotic standard errors and confidence intervals
* 17: Generating confidence intervals by Monte Carlo simulations
* 18: Generating confidence intervals via model comparison
* 19: comparing the three methods for creating confidence intervals
* 20: Using simulations to understand confidence intervals and plan
experiments
* Comparing models
* 21: Approach to comparing models
* 22: Comparing models using the extra sum-of-squares F test
* 23: Comparing models using Akaike's Information Criterion
* 24: How should you compare modes-AICe or F test?
* 25: Examples of comparing the fit of two models to one data set
* 26: Testing whether a parameter differs from a hypothetical value
* How does a treatment change the curve?
* 27: Using global fitting to test a treatment effect in one experiment
* 28: Using two-way ANOVA to compare curves
* 29: Using a paired t test to test for a treatment effect in a series
of matched experiments
* 30: Using global fitting to test for a treatment effect in a series
of matched experiments
* 31: Using an unpaired t test to test for a treatment effect in a
series of unmatched experiments
* 32: Using global fitting to test for a treatment effect in a series
of unmatched experiments
* Fitting radioligand and enzyme kinetics data
* 33: The law of mass action
* 34: Analyzing radioligand binding data
* 35: Calculations with radioactivity
* 36: Analyzing saturation radioligand binding data
* 37: Analyzing competitive binding data
* 38: Homologous competitive binding curves
* 39: Analyzing kinetic binding data
* 40: Analyzing enzyme kinetic data
* Fitting does-response curves
* 41: Introduction to dose-response curves
* 42: The operational model of agonist action
* 43: Dose-response curves in the presence of antagonists
* 44: Complex dose-response curves
* Fitting curves with GraphPad Prism
* 45: Nonlinear regression with Prism
* 46: Constraining and sharing parameters
* 47: Prsim's nonlinear regression dialog
* 48: Classic nonlinear models built-in to Prism
* 49: Importing equations and equation libraries
* 50: Writing user-defined models in Prism
* 51: Linear regression with Prism
* 52: Reading unknowns from standard curves
* 53: Graphing a family of theoretical curves
* 54: Fitting curves without regression
