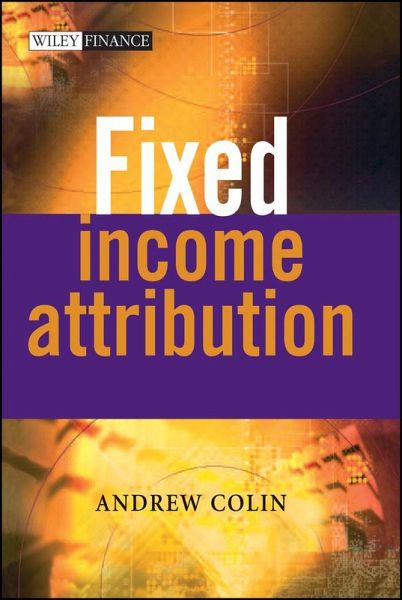
Andrew Colin
Fixed Income Attribution (eBook, PDF)
76,99 €
76,99 €
inkl. MwSt.
Sofort per Download lieferbar
0 °P sammeln
76,99 €
Als Download kaufen
76,99 €
inkl. MwSt.
Sofort per Download lieferbar
0 °P sammeln
Jetzt verschenken
Alle Infos zum eBook verschenken
76,99 €
inkl. MwSt.
Sofort per Download lieferbar
Alle Infos zum eBook verschenken
0 °P sammeln
Andrew Colin
Fixed Income Attribution (eBook, PDF)
- Format: PDF
- Merkliste
- Auf die Merkliste
- Bewerten Bewerten
- Teilen
- Produkt teilen
- Produkterinnerung
- Produkterinnerung
Bitte loggen Sie sich zunächst in Ihr Kundenkonto ein oder registrieren Sie sich bei
bücher.de, um das eBook-Abo tolino select nutzen zu können.
Hier können Sie sich einloggen
Sie sind bereits eingeloggt. Klicken Sie auf 2. tolino select Abo, um fortzufahren.
Bitte loggen Sie sich zunächst in Ihr Kundenkonto ein oder registrieren Sie sich bei bücher.de, um das eBook-Abo tolino select nutzen zu können.
Fixed income attribution is by its very nature a complex and mathematically demanding topic, and there is little information available on this area. Fixed Income Attribution has been written to fill this tremendous void. This comprehensive resource contains both theoretical and practical information about running and understanding fixed income attribution, including the mathematics of attribution, practical limitations, benchmarks, presentation tools, and choosing and running an attribution system. Filled with insightful examples and expert advice, Fixed Income Attribution is the perfect…mehr
- Geräte: PC
- mit Kopierschutz
- eBook Hilfe
- Größe: 1.49MB
Fixed income attribution is by its very nature a complex and mathematically demanding topic, and there is little information available on this area. Fixed Income Attribution has been written to fill this tremendous void. This comprehensive resource contains both theoretical and practical information about running and understanding fixed income attribution, including the mathematics of attribution, practical limitations, benchmarks, presentation tools, and choosing and running an attribution system. Filled with insightful examples and expert advice, Fixed Income Attribution is the perfect source of information for those working in this complex environment.
Dieser Download kann aus rechtlichen Gründen nur mit Rechnungsadresse in D ausgeliefert werden.
Produktdetails
- Produktdetails
- Verlag: John Wiley & Sons
- Erscheinungstermin: 5. Mai 2005
- Englisch
- ISBN-13: 9780470013588
- Artikelnr.: 37289655
- Verlag: John Wiley & Sons
- Erscheinungstermin: 5. Mai 2005
- Englisch
- ISBN-13: 9780470013588
- Artikelnr.: 37289655
- Herstellerkennzeichnung Die Herstellerinformationen sind derzeit nicht verfügbar.
ANDREW COLIN is Fixed Income Research Director for the StatPro Group plc. He has previously worked or consulted for Citibank London, Zurich Investment Management, the Commonwealth Bank, Suncorp Metway, Chubb Security, Arthur Andersen, EDS, Alcatel and the Royal Australian Navy.
Andrew is Adjunct Professor in the Faculty of Business at Queensland University of Technology, Brisbane, and holds a PhD in Mathematics from the University of St Andrews. His research interests include risk management and machine intelligence.
Preface xiii
Acknowledgements xv
A Note on Notation xvii
Part I: Concepts of Attribution 1
1 Attribution in the Investment Process 3
1.1 Introduction 3
1.2 The problem 3
1.3 Adding value to portfolios 4
1.4 Skill in investment 5
1.4.1 Luck 5
1.4.2 Skill 5
1.5 Picking the good from the bad 5
1.6 Insight from attribution 6
1.7 Example 7
1.8 Living without attribution 8
1.9 Why is attribution difficult? 9
1.10 What does this book not cover? 9
1.11 What are we aiming for? 9
2 Calculation of Returns 11
2.1 Introduction 11
2.2 Getting it right 11
2.3 Rate of return 12
2.4 Linking performance over multiple intervals 12
2.5 Performance of single securities in the presence of cash flows 12
2.6 Performance of portfolios without cash flows 13
2.7 Performance of portfolios with cash flows 13
2.8 Portfolio cash flow assumptions 14
2.9 Example 1 15
2.10 Performance contribution 16
2.11 Bringing it all together 16
2.12 The effects of futures on performance 17
2.13 Short position 17
2.14 Example 2: Some unusual asset allocations 17
2.15 Example 3: A pathological case 18
2.16 Example 4: A portfolio with zero market value 19
2.17 Geometric compounding 19
2.17.1 Stock return 19
2.17.2 Portfolio return 20
2.17.3 Sector return 20
2.18 Performance from several sources of return 20
3 Simple Attribution 23
3.1 Introduction 23
3.2 Equity attribution 23
3.3 Additive attribution 24
3.4 Basic attribution: top-down or bottom-up? 25
3.5 Which assumptions to use? 26
3.6 Example 27
3.6.1 Measuring overall investment performance 27
3.7 Attribution at the sector level 28
3.8 Attribution for single stocks 29
3.9 Combining attribution returns over time 31
3.10 Self-consistency across time 32
3.11 Summary 33
4 Yield Curves in Attribution 35
4.1 Introduction 35
4.2 Yield curves 35
4.3 What is a yield curve? 36
4.4 Why yield curves matter in attribution 36
4.5 Different types of yield 37
4.5.1 Coupon rate 37
4.5.2 Current yield (or running yield) 37
4.5.3 Yield to maturity 37
4.6 Zero-coupon yield 38
4.7 Sovereign and credit curves 38
4.8 What should a curve look like? 38
4.9 Different types of curve - advantages and disadvantages 39
4.9.1 Par curves 39
4.9.2 Duration curves 39
4.9.3 Zero-coupon curves 39
4.10 Comparing different curve types 40
4.11 How do yield curves behave? 40
4.12 Credit curves 43
4.13 Finding yield curve data 43
5 Interest Rate Risk and Portfolio Management 45
5.1 Introduction 45
5.2 Return in fixed income portfolios 45
5.3 Risk numbers and interest rate sensitivity 45
5.4 Aggregating risk numbers 46
5.5 Hedging risk 47
5.6 Portfolio structure 47
5.7 Risk immunization 48
6 Measuring Changes in Yield Curves 51
6.1 Introduction 51
6.2 Curve shapes 51
6.3 Curves - the raw data 51
6.4 A typical curve movement 51
6.5 Describing curve changes 53
6.5.1 Should one go any further? 55
6.5.2 Can one use other movement descriptions? 55
6.6 Worked examples 55
6.7 Model-free representations of curves 56
6.8 Fitted model representations 57
6.9 Shift and curve positioning analysis 57
6.10 Polynomial term structure models 58
6.10.1 Example 1: Worked example for polynomial model 59
6.11 Nelson-Siegel term structure models 60
6.11.1 Example 2: Worked example for Nelson-Siegel model 62
6.12 Principal component analysis 63
6.13 Fitting data to models 64
6.14 Constraints in curve fitting 64
7 Converting Yield Movements into Performance 65
7.1 Pricing from first principles 65
7.2 Measuring the effects of yield curve shifts 66
7.3 Perturbational pricing 67
Part II: Sources of Attribution Return 71
8 The Hierarchy of Fixed Income Returns 73
8.1 Subjectivity in attribution 73
8.2 Excess precision 73
9 Yield Return and Coupon Return 75
9.1 Yield return 75
9.2 Decomposition into coupon and convergence return 75
9.3 Coupon return 75
9.4 Convergence return 76
9.5 Decomposition into systematic and specific return 76
9.6 Calculating yield return 77
10 Treasury Curve Return 79
10.1 Movements in the Treasury curve 79
10.2 No curve analysis 79
10.3 Shift/twist/butterfly 79
10.4 Duration attribution 80
11 Roll Return 83
11.1 Introduction 83
11.2 Maximizing roll return 83
11.3 Measuring roll return 84
11.4 Measuring the effect of roll 85
11.5 Separating roll return from yield curve return 85
12 Credit Return 87
12.1 Introduction 87
12.2 Credit spread and security-specific return 87
12.3 Curves and securities 88
12.4 Fine structure credit curve movement 88
12.5 Different types of credit attribution 89
12.6 Swap curve attribution 89
12.7 Credit curve attribution 89
12.8 Sector curve attribution 92
12.9 Country attribution 93
13 Optionality Return 95
14 Asset Allocation Return 97
14.1 Case 1 97
14.2 Case 2 98
14.3 Case 3 98
15 Other Sources of Return 101
15.1 Convexity return 101
15.2 Liquidity (security-specific) return 101
15.3 Trading and price return 102
15.4 Residual return 103
16 Worked Examples 105
16.1 Example 1: Yield return and term structure return 105
16.1.1 Decomposing returns 106
16.2 Example 2: Yield return and detailed term structure return 106
Part III: Fixed Income Attribution in Practice 109
17 Implementing an Attribution System 111
17.1 Build or buy? 111
17.2 Match to existing investment process 111
17.3 Can the attribution approach be extended? 111
17.4 Performance calculation engine 111
17.5 Integration with other systems 112
17.6 Benchmark and data issues 112
17.7 Reporting 112
17.8 IT requirements 113
17.9 Cost 113
17.10 Time 113
17.11 Management support 113
17.12 Intellectual capital 113
17.13 Interface to legacy systems 114
17.14 User expectations 114
17.15 In general 114
18 Fixed Income Benchmarks 115
18.1 Introduction 115
18.2 Benchmark replication 116
18.3 Availability of data 117
18.4 Replicating benchmark returns from data 118
18.5 Treatment of cash 119
19 Presenting Attribution Results 121
19.1 Introduction 121
19.2 Reporting formats 121
19.3 Presenting numerical data 122
19.3.1 Paper reports 122
19.3.2 On-line reporting 122
19.3.3 OLAP technology 122
19.4 Presenting graphical data 126
19.5 Report design 131
20 Beyond Fixed Income Attribution 133
20.1 Fixed income attribution in the investment process 133
20.1.1 Improved term structure modelling 133
20.1.2 Risk and reward 134
20.1.3 What-if risk modelling 135
20.1.4 Portfolio optimizers 135
20.1.5 Systems integration 136
20.2 Conclusion 136
Appendix A Derivation of the Normal Equations for a Least Squares Fit 137
A.1 Polynomial functions 137
A.2 Nelson-Siegel functions 137
References 139
Index 141