25,99 €
25,99 €
inkl. MwSt.
Sofort per Download lieferbar
payback
0 °P sammeln
25,99 €
25,99 €
inkl. MwSt.
Sofort per Download lieferbar

Alle Infos zum eBook verschenken
payback
0 °P sammeln
Als Download kaufen
25,99 €
inkl. MwSt.
Sofort per Download lieferbar
payback
0 °P sammeln
Jetzt verschenken
25,99 €
inkl. MwSt.
Sofort per Download lieferbar

Alle Infos zum eBook verschenken
payback
0 °P sammeln
  • Format: PDF

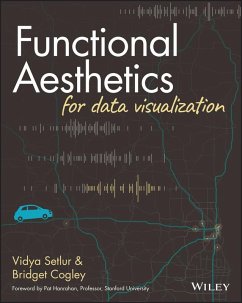
What happens when a researcher and a practitioner spend hours crammed in a Fiat discussing data visualization? Beyond creating beautiful charts, they found greater richness in the craft as an integrated whole. Drawing from their unconventional backgrounds, these two women take readers through a journey around perception, semantics, and intent as the triad that influences visualization. This visually engaging book blends ideas from theory, academia, and practice to craft beautiful, yet meaningful visualizations and dashboards. How do you take your visualization skills to the next level? The…mehr

Produktbeschreibung
What happens when a researcher and a practitioner spend hours crammed in a Fiat discussing data visualization? Beyond creating beautiful charts, they found greater richness in the craft as an integrated whole. Drawing from their unconventional backgrounds, these two women take readers through a journey around perception, semantics, and intent as the triad that influences visualization. This visually engaging book blends ideas from theory, academia, and practice to craft beautiful, yet meaningful visualizations and dashboards. How do you take your visualization skills to the next level? The book is perfect for analysts, research and data scientists, journalists, and business professionals. Functional Aesthetics for Data Visualization is also an indispensable resource for just about anyone curious about seeing and understanding data. Think of it as a coffee book for the data geek in you. https://www.functionalaestheticsbook.com

Dieser Download kann aus rechtlichen Gründen nur mit Rechnungsadresse in A, B, BG, CY, CZ, D, DK, EW, E, FIN, F, GR, HR, H, IRL, I, LT, L, LR, M, NL, PL, P, R, S, SLO, SK ausgeliefert werden.

Autorenporträt
VIDYA SETLUR, PhD, is the head of Tableau Research. She earned her doctorate in Computer Graphics in 2005 at Northwestern University. Her expertise is in natural language processing and computer graphics, and she seeks to develop new algorithms and user interfaces that enhance communication and understanding. BRIDGET COGLEY is the Chief Visualization Officer at Versalytix and is a Tableau Hall of Fame Visionary. As an American Sign Language interpreter turned analyst, her practice incorporates semantics to draw meaning in her designs. She focuses on innovative use cases in data visualization.
Rezensionen
"Straight away, you can tell this is a labour of love - the enthusiasm and validity with which the authors describe elements from the three elements of theory, academia and practice really shine through. With backgrounds covering all three of these areas, it makes for a complete publication, full of examples not just from practical situations as a practitioner, but from theory - focusing in particular on theory of presentation, psychology, conversation and cognition. All things which influence creation of functional and aesthetic dashboards, most of which, like me, you probably hadn't considered in requisite depth until now..."
--Neil Richards, four time Tableau Visionary and Director of Editorial for Viz For Social Good