Dieser Download kann aus rechtlichen Gründen nur mit Rechnungsadresse in A, B, BG, CY, CZ, D, DK, EW, E, FIN, F, GR, HR, H, IRL, I, LT, L, LR, M, NL, PL, P, R, S, SLO, SK ausgeliefert werden.
-Jasmin Wachter, Universität Klagenfurt
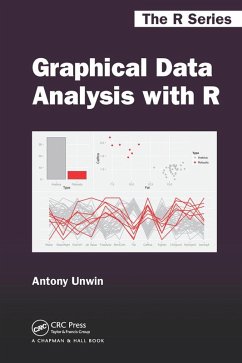
"Overall, the book is a very good introduction to the practical side of graphical data analysis using R. The presentation of R code and graphics output is excellent, with colours used when required. The book appears to be free of typographical and other errors, and its index is useful. Also, the book is well written and neatly structured. I enjoyed reading the book and can recommend it to anyone who wants to learn more about their data through graphics using R. It will also be a valuable asset for a library and as part of an undergraduate course in applied statistics."
-Journal of the Royal Statistical Society, Series A
"Throughout, the book follows a learning-by-doing approach. With numerous examples, the author shows how important qualitative aspects of data can be detected by means of simple plots, and how a few simple changes in a graph may uncover relevant information not visible before, setting aside the more technical aspects of plots in R. Still, for each graph, the respective R-code is provided in the book, and complete programme codes for the examples ae available on the book's webpage. ... This blended-learning approach facilitates exploring the data graphically without requiring too much knowledge of R syntax. This book is therefore well suited for students and novice data analysts who want to learn from examples. It could also supplement theoretical statistics courses, and help statistics teachers in finding suitable graphical displays for various purposes."
-Statistical Papers, 2017
"... an attractive addition to the current statistical graphics texts as it demonstrates what can be learned through graphs."
-Significance Magazine, February 2016
"... the strength of this book lies in the profound introduction to the topic of graphical data analysis. The comprehensive sectional introductions and overviews along with the 'how-to' might well be regarded as the modern update to Tukey's 1977 landmark book."
-Biometrical Journal, December 2015
"Antony Unwin's very clever new book ... is well written, clearly by a practitioner with wide experience, gives generally good (though sometimes opinionated) advice, and includes R code for nearly all examples, as well as nice collections of additional exercises for each chapter ... Beyond the content, Unwin also does an admirable job of conveying enthusiasm for data graphics."
-Journal of Educational and Behavioral Statistics, December 2015
"This text has the potential of bringing sophisticated visualization to a broad audience without resorting to mathematical formalizations or the skills of a graphics artist. It engages the reader with interesting graphics right from the start and overall is clear and unintimidating. Code for all examples is provided in the text and is available on a supporting website. What's more, the code works as is, rather unusual and refreshing."
-Journal of Statistical Software, November 2015
"For statisticians and experts in data analysis, the book is without doubt the new reference work on the subject."
-Thomas Rahlf, datendesign-r.de
...would also be an excellent suggested additional reading for a pragmatic graphical data analysis-oriented course.
-Reijo Sund, Centre for Research Methods, University of Helsinki

