Alle Infos zum eBook verschenken
- Format: PDF
- Merkliste
- Auf die Merkliste
- Bewerten Bewerten
- Teilen
- Produkt teilen
- Produkterinnerung
- Produkterinnerung
Hier können Sie sich einloggen
Bitte loggen Sie sich zunächst in Ihr Kundenkonto ein oder registrieren Sie sich bei bücher.de, um das eBook-Abo tolino select nutzen zu können.
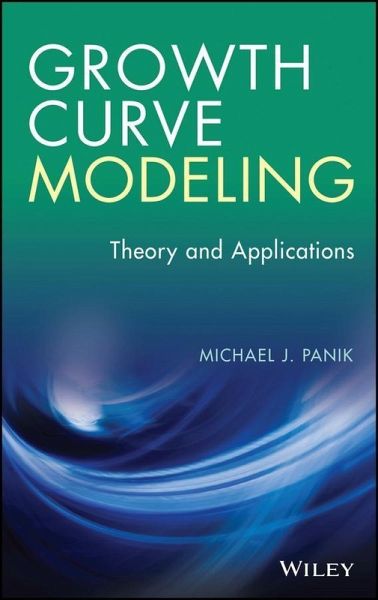
Features recent trends and advances in the theory and techniques used to accurately measure and model growth Growth Curve Modeling: Theory and Applications features an accessible introduction to growth curve modeling and addresses how to monitor the change in variables over time since there is no "one size fits all" approach to growth measurement. A review of the requisite mathematics for growth modeling and the statistical techniques needed for estimating growth models are provided, and an overview of popular growth curves, such as linear, logarithmic, reciprocal, logistic, Gompertz, Weibull,…mehr
- Geräte: PC
- mit Kopierschutz
- eBook Hilfe
- Größe: 5.72MB
- Michael J. PanikGrowth Curve Modeling (eBook, ePUB)122,99 €
- Jussi KlemeläMultivariate Nonparametric Regression and Visualization (eBook, PDF)91,99 €
- Yosef CohenStatistics and Data with R (eBook, PDF)85,99 €
- Damaraju RaghavaraoRepeated Measurements and Cross-Over Designs (eBook, PDF)113,99 €
- Dirk TaegerStatistical Hypothesis Testing with SAS and R (eBook, PDF)73,99 €
- Samprit ChatterjeeHandbook of Regression Analysis With Applications in R (eBook, PDF)100,99 €
- Thomas W. O'GormanAdaptive Tests of Significance Using Permutations of Residuals with R and SAS (eBook, PDF)127,99 €
-
-
-
Dieser Download kann aus rechtlichen Gründen nur mit Rechnungsadresse in A, B, BG, CY, CZ, D, DK, EW, E, FIN, F, GR, HR, H, IRL, I, LT, L, LR, M, NL, PL, P, R, S, SLO, SK ausgeliefert werden.
- Produktdetails
- Verlag: Wiley-Blackwell
- Seitenzahl: 464
- Erscheinungstermin: 5. Dezember 2013
- Englisch
- ISBN-13: 9781118763902
- Artikelnr.: 40141883
- Verlag: Wiley-Blackwell
- Seitenzahl: 464
- Erscheinungstermin: 5. Dezember 2013
- Englisch
- ISBN-13: 9781118763902
- Artikelnr.: 40141883
- Herstellerkennzeichnung Die Herstellerinformationen sind derzeit nicht verfügbar.
Is AR(1) 111 4.6.2 Testing for the Absence of Autocorrelation: The Durbin-Watson Test 113 4.6.3 Detection of and Estimation with Autocorrelated Errors 115 4.7 Polynomial Models in t 126 4.8 Issues Involving Trended Data 136 4.8.1 Stochastic Processes and Time Series 137 4.8.2 Autoregressive Process of Order p 138 4.8.3 Random Walk Processes 141 4.8.4 Integrated Processes 145 4.8.5 Testing for Unit Roots 146 Appendix 4.A OLS Estimated and Related Growth Rates 158 4.A.1 The OLS Growth Rate 158 4.A.2 The Log-Difference (LD) Growth Rate 161 4.A.3 The Average Annual Growth Rate 161 4.A.4 The Geometric Average Growth Rate 162 5 Dynamic Site Equations Obtained from Growth Models 164 5.1 Introduction 164 5.2 Base-Age-Specific (BAS) Models 164 5.3 Algebraic Difference Approach (ADA) Models 166 5.4 Generalized Algebraic Difference Approach (GADA) Models 169 5.5 A Site Equation Generating Function 179 5.5.1 ADA Derivations 180 5.5.2 GADA Derivations 180 5.6 The Grounded GADA (g-GADA) Model 184 Appendix 5.A Glossary of Selected Forestry Terms 186 6 Nonlinear Regression 188 6.1 Intrinsic Linearity/Nonlinearity 188 6.2 Estimation of Intrinsically Nonlinear Regression Models 190 6.2.1 Nonlinear Least Squares (NLS) 191 6.2.2 Maximum Likelihood (ML) 195 Appendix 6.A Gauss-Newton Iteration Scheme: The Single Parameter Case 214 Appendix 6.B Gauss-Newton Iteration Scheme: The r Parameter Case 217 Appendix 6.C The Newton-Raphson and Scoring Methods 220 Appendix 6.D The Levenberg-Marquardt Modification/Compromise 222 Appendix 6.E Selection of Initial Values 223 6.E.1 Initial Values for the Logistic Curve 224 6.E.2 Initial Values for the Gompertz Curve 224 6.E.3 Initial Values for the Weibull Curve 224 6.E.4 Initial Values for the Chapman-Richards Curve 225 7 Yield-Density Curves 226 7.1 Introduction 226 7.2 Structuring Yield-Density Equations 227 7.3 Reciprocal Yield-Density Equations 228 7.3.1 The Shinozaki and Kira Yield-Density Curve 228 7.3.2 The Holliday Yield-Density Curves 229 7.3.3 The Farazdaghi and Harris Yield-Density Curve 230 7.3.4 The Bleasdale and Nelder Yield-Density Curve 231 7.4 Weight of a Plant Part and Plant Density 239 7.5 The Expolinear Growth Equation 242 7.6 The Beta Growth Function 249 7.7 Asymmetric Growth Equations (for Plant Parts) 253 7.7.1 Model I 254 7.7.2 Model II 255 7.7.3 Model III 256 Appendix 7.A Derivation of the Shinozaki and Kira Yield-Density Curve 257 Appendix 7.B Derivation of the Farazdaghi and Harris Yield-Density Curve 258 Appendix 7.C Derivation of the Bleasdale and Nelder Yield-Density Curve 259 Appendix 7.D Derivation of the Expolinear Growth Curve 261 Appendix 7.E Derivation of the Beta Growth Function 263 Appendix 7.F Derivation of Asymmetric Growth Equations 266 Appendix 7.G Chanter Growth Function 269 8 Nonlinear Mixed-Effects Models for Repeated Measurements Data 270 8.1 Some Basic Terminology Concerning Experimental Design 270 8.2 Model Specification 271 8.2.1 Model and Data Elements 271 8.2.2 A Hierarchical (Staged) Model 272 8.3 Some Special Cases of the Hierarchical Global Model 274 8.4 The SAS/STAT NLMIXED Procedure for Fitting Nonlinear Mixed-Effects Model 276 9 Modeling the Size and Growth Rate Distributions of Firms 293 9.1 Introduction 293 9.2 Measuring Firm Size and Growth 294 9.3 Modeling the Size Distribution of Firms 294 9.4 Gibrat's Law (GL) 297 9.5 Rationalizing the Pareto Firm Size Distribution 299 9.6 Modeling the Growth Rate Distribution of Firms 300 9.7 Basic Empirics of Gibrat's Law (GL) 305 9.7.1 Firm Size and Expected Growth Rates 305 9.7.2 Firm Size and Growth Rate Variability 308 9.7.3 Econometric Issues 310 9.7.4 Persistence of Growth Rates 312 9.8 Conclusion 313 Appendix 9.A Kernel Density Estimation 314 9.A.1 Motivation 314 9.A.2 Weighting Functions 315 9.A.3 Smooth Weighting Functions: Kernel Estimators 316 Appendix 9.B The Log-Normal and Gibrat Distributions 322 9.B.1 Derivation of Log-Normal Forms 322 9.B.2 Generalized Log-Normal Distribution 325 Appendix 9.C The Theory of Proportionate Effect 326 Appendix 9.D Classical Laplace Distribution 328 9.D.1 The Symmetric Case 328 9.D.2 The Asymmetric Case 330 9.D.3 The Generalized Laplace Distribution 331 9.D.4 The Log-Laplace Distribution 332 Appendix 9.E Power-Law Behavior 332 9.E.1 Pareto's Power Law 333 9.E.2 Generalized Pareto Distributions 335 9.E.3 Zipf's Power Law 337 Appendix 9.F The Yule Distribution 338 Appendix 9.G Overcoming Sample Selection Bias 339 9.G.1 Selection and Gibrat's Law (GL) 339 9.G.2 Characterizing Selection Bias 339 9.G.3 Correcting for Selection Bias: The Heckman (1976 1979) Two-Step Procedure 342 9.G.4 The Heckman Two-Step Procedure Under Modified Selection 345 10 Fundamentals of Population Dynamics 352 10.1 The Concept of a Population 352 10.2 The Concept of Population Growth 353 10.3 Modeling Population Growth 354 10.4 Exponential (Density-Independent) Population Growth 357 10.4.1 The Continuous Case 357 10.4.2 The Discrete Case 359 10.4.3 Malthusian Population Growth Dynamics 361 10.5 Density-Dependent Population Growth 363 10.5.1 Logistic Growth Model 364 10.6 Beverton-Holt Model 371 10.7 Ricker Model 374 10.8 Hassell Model 377 10.9 Generalized Beverton-Holt (B-H) Model 380 10.10 Generalized Ricker Model 382 Appendix 10.A A Glossary of Selected Population Demography/Ecology Terms 389 Appendix 10.B Equilibrium and Stability Analysis 391 10.B.1 Stable and Unstable Equilibria 391 10.B.2 The Need for a Qualitative Analysis of Equilibria 392 10.B.3 Equilibria and Stability for Continuous-Time Models 392 10.B.4 Equilibria and Stability for Discrete-Time Models 394 Appendix 10.C Discretization of the Continuous-Time Logistic Growth Equation 400 Appendix 10.D Derivation of the B-H S-R Relationship 401 Appendix 10.E Derivation of the Ricker S-R Relationship 403 Appendix A 405 Table A.1 Standard Normal Areas (Z Is N(0, 1)) 405 Table A.2 Quantiles of Student's t Distribution (T Is tv) 407 Table A.3 Quantiles of the Chi-Square Distribution (X Is
v 2) 408 Table A.4 Quantiles of Snedecor's F Distribution (F Is Fv1, v2) 410 Table A.5 Durbin-Watson DW Statistic-5% Significance Points dL and dU (n is the sample size and k
is the number of regressors excluding the intercept) 415 Table A.6 Empirical Cumulative Distribution of
for
= 1 419 References 420 Index 431